 Dedicated FREE FOREX VPS
 Free FOREX Virtual Private Server
 MT4 Demo Contest, Get $500
 Sign Up for an Account, Claim 60% Deposit Bonus
 Free MT4/MT5 VPS 2024
 Send E-mail and Get Free Merchandise
 $1K Refer a Friend Bonus for Pepperstone Pro clients
 Maximize Your Earnings with 100% Deposit bonus
 Trade to Win, $5,000 Monthly Demo Contest
 Claim 30% + 15% Deposit Bonus from LiteFinance
The 89 EMA breakout strategy is great for long-term trading and applicable to any financial market. Read further to learn how it works.

The Exponential Moving Average (EMA) is one of the most prominent elements in technical analysis. It is one of the most popular indicators used by thousands of traders from all around the globe. Many traders like to use moving average due to its effectiveness and reliability. The EMA strategy is typically used to identify the predominant trend in the market and also to help traders determine the support and resistance levels of their trade execution. Apart from that, EMA strategies are also known to be universal, which means it is flexible and can be applied to almost any type of market with various timeframes.
Today, we're going to talk about the 89 EMA strategy for breakout trading, starting from the general concept, setup, trade management, and the different variations that you can try for your trade. The strategy is particularly suitable for longer-term trades and for traders who don't have time to sit in front of the computer the whole time. With this strategy, the trader should only look at the chart at least once a day to check on their positions.
Contents
The 89 EMA Breakout Strategy
The grand strategy that we're using here is called the ten bar breakout strategy. It is basically a trend-following strategy where you should wait for the price to break the previous higher high or lower low of the last ten candles on the chart. You will then have to adjust the stop loss in the direction of your trade following the chart's progression.
In this strategy, we're going to use the 89 EMA. Here is the step-by-step guide that you can follow:
Entering the Market
- Identify the Trend Direction
First of all, we should identify where the trend is more likely to be moving by using the 89 EMA line. This will determine whether we should enter a long or short trade.
Once you have the 89 EMA added to your chart, pay attention to the very last candle. If it's currently above the moving average line, you should take long trades and in contrast, if it's below the moving average, then it's your cue to only open short trades. - Find an Entry Point
After determining which way you're going to trade, it's time to decide the setup for the trade. Again, start by looking at the last candle and then count back by ten candles. Once you find the boundary line that separates the ten candles from the rest, the next step would be to find the high and the low within the area.
The high and the low of those ten candles are actually very crucial because it determines both your entry point and pending stop loss. In a short trade, you should place your pending sell order at the lowest point and the pending stop loss order at the highest point. In contrast, in a long trade, place the pending buy order at the highest point and the pending stop loss order at the lowest point. - Open a Pending Order
Now that you already figured out where to enter the market, you can simply enter a pending order that will automatically put you in the game once the candle breaks through the high or low points of the last ten candlesticks.
The chart below shows an example of a possible scenario of a short trade. The red shaded area shows the last ten candlesticks. Place the pending order at the lowest point of the ten candlesticks (number 2) and place the pending stop loss at the highest point (number 1).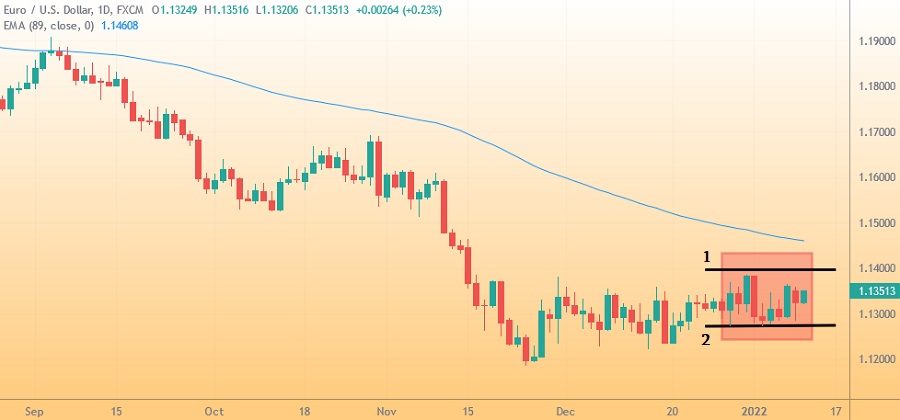
Managing the Trade
Since the strategy is based on the high and low of only the last ten candlesticks of the chart, it's highly important to note that when a new candle is formed, the highest and lowest points are also going to change. That means, your overall trade setup should also change according to the latest condition.
You should readjust the pending order and the pending stop loss set up according to the new highest point and the new lowest point. The point is that as long as the pending order hasn't been triggered yet, you would have to continue adjusting the pending entry order and the pending stop loss to the new high and low points respectively as new candle forms. If the high and lows remain the same as new candles form, then you wouldn't have to change anything on your pending orders.
Moreover, the adjustment should continue even after the pending order is triggered. Once you have an open position going, you would need to adjust the stop loss shown by the last ten candlesticks on the chart.
Adjusting the Strategy
The 89 EMA breakout strategy is essentially mechanical, which means that you can trade without having to make any judgment in your decisions, other than following the rules of the strategy. You just simply have to stick to the rules and execute your trade once the conditions are met. But as time goes by, you might notice repetitive patterns in the market and perhaps even develop your own analysis of the market.
In this case, this strategy also provides room for adjustment. Meaning, you can make changes in the strategy in order to suit how you personally trade. Here are some of the things that you can adjust according to your preference:
1. The Moving Average
Firstly, you can change the moving average itself. The basic rule is to use the 89 EMA, which means that the calculation takes into account the last 89 periods or days when used on a daily time frame. But you can actually change it to any number you want.
In theory, the higher the period of the moving average, the slower it will respond to any market changes. Consequently, the lower the period of the moving average, the faster it will respond to a change in the trend direction. So for instance, if you use 50 EMA instead of 89, then the calculation will only focus on the last 50 days. This means that the moving average line would react more quickly to price changes compared to the one that uses 89 EMA.
Using a lower period moving average might be able to quickly detect price changes and thus, enable you to trade in the right direction almost immediately as the trend change.
However, it's worth mentioning that such a condition might also increase the probability of getting a false signal on the market. Sometimes, the lower period moving average would detect a change, but it turns out to be a temporary price correction in the overall direction. So, although it comes with the advantage of detecting the change quickly, it's not always the most effective way to trade.
With that being said, a higher period moving average is more likely to keep you on the right track and filter your false signals. Using a higher period moving average means that it only responds to significant price changes. In other words, the price might stay above the moving average line in an uptrend or below in a downtrend, even when the price is temporarily correcting.
2. The Number of Candlesticks
The basic rule is to use ten of the latest candlesticks on the chart, but you can actually use any number you wish. One of the best options is to increase the number of candlesticks or bars that you use to define the highest and lowest points of the trade. This can be useful to avoid false signals on a ranging market.
If you lengthen the area, you will have a wider range of candles that will define the strategy, so you are likely to get a higher or a lower price than you use for the breakout. As a result, you will have a better trading signal because if there's a ranging market, you will more likely to stay out of the trade until the price has broken out of the range. The only drawback is perhaps the exit point would also be a higher high or a lower low so you are likely to get less profit.
The Bottom Line
The 89 EMA strategy provides an excellent way to take profit rather easily in technical trading. One of the greatest advantages of this strategy is flexibility because it is suitable for any trader and basically applicable in any financial market.
As explained above, the strategy is more or less adjustable because you can change some of the elements in it according to your preference.
Even though it doesn't require you to look at the chart very closely at all times, but it's still necessary to check on it at least once a day in order to ensure that everything's going well and make some adjustments to the pending orders if needed.
However, keep in mind that changing the basic rules might change the dynamic and the effectiveness of the strategy so always make sure to test the variations of the rules before using them in a live account. It's always a great idea to use a demo account to test your strategy, no matter how experienced you are in trading.


2 Comments
Agam
Jan 23 2024
According to the article, the primary strategy discussed is the ten bar breakout strategy, centered around the 89 EMA. This strategy is essentially a trend-following approach that involves patiently waiting for the price to surpass the previous highest high or lowest low observed in the last ten candlesticks on the chart. Subsequently, it is recommended to adjust the stop-loss in alignment with the trade's direction based on the chart's evolving patterns.
I'm curious about the reference to "bars" in this context – if I recall correctly, "bar" refers to a candlestick, right? I'm seeking a more in-depth understanding of the ten bar breakout concept, as the article doesn't provide a clear explanation of it.
Inno
Jan 25 2024
You are right! The ten bar breakout strategy involves using the 89 EMA to identify trends in a trend-following approach. "Bars" refer to candlesticks, and the strategy requires waiting for the price to exceed the highest high or lowest low observed in the last ten candlesticks on the chart. This ten-candle period serves as a crucial timeframe for assessing market movements. For instance, if the price breaks above the highest high or below the lowest low within these ten candles, it signals a potential trend change or continuation. The key is to be patient and let the market reveal its direction. To manage risk, it's recommended to adjust the stop-loss in the direction of the trade, aligning with the evolving chart patterns. This strategy offers a systematic approach to navigating trends and making informed trading decisions based on recent price action.
I suggest you to read the article about price action because this strategy basically need you to read the candlestick or bar which is the basic of price action! (read : How to Master Price Action Trading with Candlesticks)