 Dedicated FREE FOREX VPS
 Free FOREX Virtual Private Server
 MT4 Demo Contest, Get $500
 Sign Up for an Account, Claim 60% Deposit Bonus
 Free MT4/MT5 VPS 2024
 Send E-mail and Get Free Merchandise
 $1K Refer a Friend Bonus for Pepperstone Pro clients
 Maximize Your Earnings with 100% Deposit bonus
 Trade to Win, $5,000 Monthly Demo Contest
 Claim 30% + 15% Deposit Bonus from LiteFinance
More than just a Moving Average, Linear Weighted Moving Average (LWMA) is recommended for scalpers for its responsive and reliable nature. Here's how to use it in a simple strategy.

With inflation getting higher in many countries, young people start to look for money-making alternatives that will give them extra bucks. Trading has become one of the most popular side hustles for these youngsters. Many trading platforms have received tons of new young traders over the years, but how do they trade? What strategy do they use and what strategy is easy to use by beginners?
The method presented in this article is a scalping trading system for the forex market that is suited for new traders due to its simplicity, and it is capable of providing good profits in trending markets. To narrow down the indicator options, we have specifically chosen the Linear Weighted Moving Average (LWMA). Why is it picked and how does it work for scalping strategy?
Introduction to Linear Weighted Moving Average (LWMA)
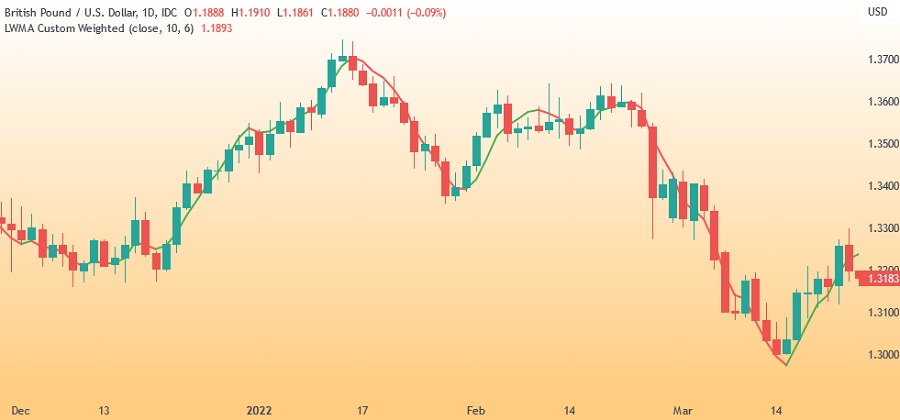
A Linear Wighted Moving Average (LWMA) is a Moving Average computation that weights recent price data more highly. The most recent price has the most weight, while each previous price has less weight. The weights fall in a straight path. LWMAs react to price changes faster than the Simple Moving Average (SMA) and even Exponential Moving Average (EMA).
What Does the Linear Weighted Moving Average (LWMA) Tell You?
When the price is above the LWMA and the LWMA is increasing, it indicates that the price is above the weighted average, which helps confirm an uptrend. If the price is lower than the LWMA and the LWMA is pointing downward, this helps corroborate a price downturn.
When the price crosses the LWMA, it might indicate a shift in trend. If the price is above the LWMA and subsequently falls below it, this might suggest a change from an uptrend to a downtrend.
Traders should be mindful of the lookback period while examining trends. The lookback period is the number of periods used to compute the LWMA. A 5-period LWMA closely tracks the price and is excellent for detecting modest trends since the line is easily broken by even minor price fluctuations. A 100-period LWMA on the other hand, will not track the price as closely, leaving space between the LWMA and the price. This enables the identification of longer-term trends and reversals.
The LWMA, like other forms of Moving Averages, may also be used to show regions of dynamic support and resistance. For example, the price could bounce off of the LWMA several times before moving upward. This means that the line is providing support. The line might continue to provide help in the future. Failure to do so may signal that the pricing trend has shifted. It might be reverting to the downside or beginning a period of further sideways movement.
The Complete Setup
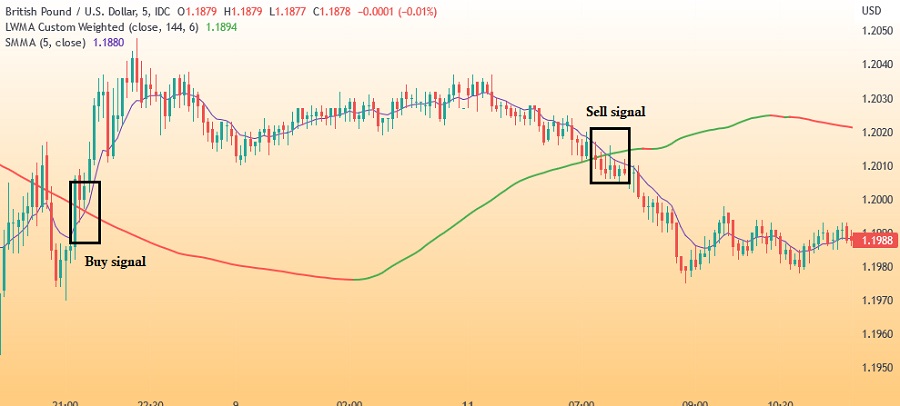
For the scalping strategy, we would need two Moving Average lines: a 144-period LWMA and a 5-period SMMA (Smoothed Moving Average). A crossover between these Moving Averages would be the reference signal. As always, it is advised to test this approach on a demo account before employing it in a live account.
- Indicators: 144 LWMA and 5 SMMA
- Currency pairs: The system can be applied in all currency pairs and even in other markets, such as precious metals (gold & silver spot).
- Recommended time frames: This system was designed to operate in 5-minute price charts.
- Trading periods: New York and London sessions.
Buy Rules:
- The 5 SMMA crosses the 144 LWMA higher (bullish crossover). Open a position following a bullish candlestick formed after the crossover.
- Stop loss around 15 pips below the entry point or 15 pips below the most recent swing low.
- The profit-taking target is set 20 pips above the entry point.
Sell Rules:
- The 5 SMMA crosses below the 144 LWMA from above (bearish crossover). Open a position immediately after a bearish candlestick following the crossover.
- The stop loss is set at 15 pips above the entry point or 15 pips above the nearest swing high, whichever is more suitable for you.
- The profit-taking target is placed 20 pips below the entry point.
Examples of trading signals on the M5 chart of GBP/USD:
Beware the Risks
When Moving Averages are available, they serve to identify trends, but they give little information when price action is choppy or moving in a range. Price will swing around the MA at such periods. During such circumstances, the MA will not offer enough crossover or support/resistance signals.
An LWMA may or may not offer support or resistance. Before a strong trend emerges, several false signals may occur. A false signal occurs when the price crosses the LWMA but fails to advance in the predicted direction, resulting in a bad transaction.
In conclusion, while this strategy is quite easy for a newbie trader, it can be very tricky without proper training and experience. Some of the signals might be false and we can start the trade too late or too fast so we cannot get the maximum profit out of it. That's why you always need to try these strategies in your demo account first. Nevertheless, it only involves one moving chart, so for newbie traders who are still unsure and figuring out how the chart and candles work in the trading scene, this is very beneficial to hone their skills in reading price signals and how they interact with indicators.