 Dedicated FREE FOREX VPS
 Free FOREX Virtual Private Server
 MT4 Demo Contest, Get $500
 Sign Up for an Account, Claim 60% Deposit Bonus
 Free MT4/MT5 VPS 2024
 Send E-mail and Get Free Merchandise
 $1K Refer a Friend Bonus for Pepperstone Pro clients
 Maximize Your Earnings with 100% Deposit bonus
 Trade to Win, $5,000 Monthly Demo Contest
 Claim 30% + 15% Deposit Bonus from LiteFinance
200 EMA is a popular technical indicator that can be used in various trading strategies, including position trading. How to optimize the tool?
Exponential Moving Average (EMA) is a trading indicator that aims to find the average and trend of the price data and it appears as a line on the chart. There are a number of good periods to use, but the 200 EMA is one of the best options as it is pretty simple yet able to provide crucial information for your trade. The outcome of the 200 EMA is also very clear to see compared to other EMA periods. It is called 200 EMA because it consists of the data collected in the last 200 days. Here's what it looks like this on the chart.
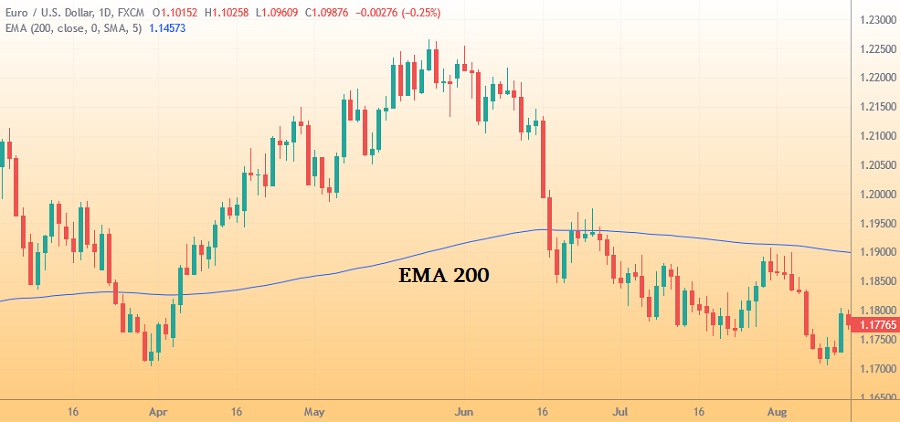
Typically, the indicator would automatically show you the calculation result on the chart in the form of a line. 200 days is a pretty long period in forex trading, so 200 EMA is considered as a long-term indicator. It means that you can use it to identify and trade with a long-term trend.
One of the most common misconceptions about trading with 200 EMA is that it can provide an exact spot of entry. Bear in mind that 200 EMA is a long-term indicator, so it is best used for highlighting long-term trends in the market rather than focusing on short-term movements. One strategy popularly associated with long-term strategies is position trading.
What Is Position Trading?
Position trading is a type of long-term forex trading method. Basically, a position trader would open trade and hold it for quite a long period in a hope that the price will rise in value over time. This type of trader usually doesn't pay much attention to short-term price movements. Instead, they tend to focus on long-term price changes and see the chart from a bigger perspective. Unlike day traders who could open multiple trades a day, position traders only open a few (mostly less than 10) trades per year.
The main idea of position trading is to trade following the big trend. Even so, note that position trading is different from buy-and-hold trading because the latter typically holds their positions for even a longer time. Buy-and-hold traders are often called passive investors and they tend to focus on a long-term goal, such as retirement. Meanwhile, position traders would identify a trend first before deciding to buy based on that trend. Then they would wait for the price to go up and sell the asset once it is profitable enough.
In a nutshell, position traders make profits from an upward long-term trend and use the opportunity to sell the price at a much higher price after a certain period of time. This is pretty much the opposite of day traders where traders seek to take profit from short-term market movements. In between the two points are the swing traders who might open a position for as long as a few weeks or months.
Using 200 EMA for Position Trading
Since 200 EMA is a long-term indicator, it is suitable for position trading. The basic principle that you can follow is to open a buy position when the price moves above the 200 EMA line and open a sell position when the price moves below the 200 EMA line. Here are 3 ways to trade with 200 EMA:
Use the 200 EMA as a Directional Bias
The first thing that you can do is use the 200 EMA to show the directional bias. This means that the EMA line will help you identify the overall trend of the market and thus, help you determine what type of position that you could open. Here is an easy example:
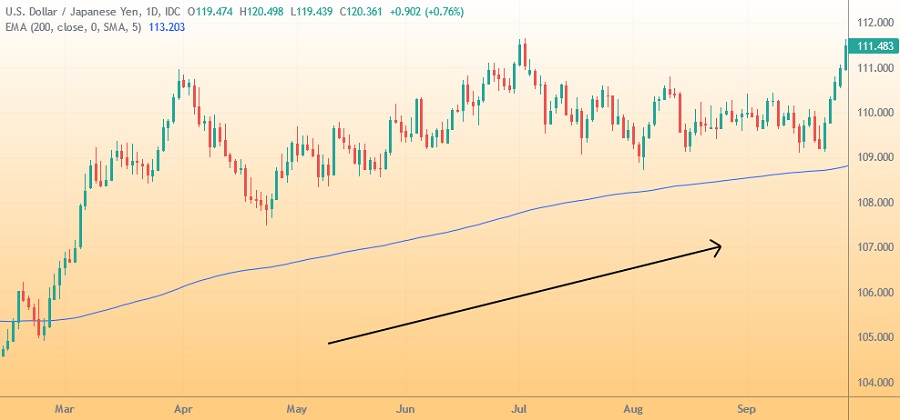
From the USD/JPY chart above, we can see that the overall trend is bullish. To confirm it further, we can see that the price is steadily going above the 200 EMA. We can then assume that the price will continue to move upward until it breaks the 200 EMA line. This is the directional bias that we're looking for. On the contrary, if the overall trend is bearish and the price is moving below the 200 EMA, then we can assume that the price will continue to move downward.
Use the 200 EMA with Support/Resistance
The next thing that you can do is to combine the 200 EMA with another form of price action confluence. A confluence basically means that you use more than one technique to increase your odds of winning a trade. In this case, we're going to use 200 EMA and combine it with key support and resistance levels. Let's take a look at the example below.
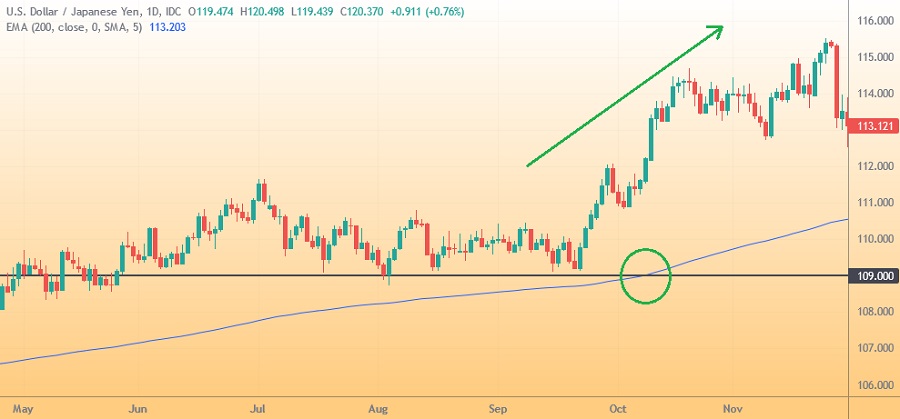
On the chart above, notice that the price has been consistently moving above 200 EMA. To find the right momentum to buy, the confluence in which the 200 EMA crossed above the key support could be a good point. The strategy was proven right when the price exponentially rose from the confluence area.
Open Trade When the Price Rejects the 200 EMA
Another common way to use 200 EMA is to enter the trade when the price rejects or bounces off of the EMA line. Sometimes, the 200 EMA can be so powerful that the price would just move away from the line and reject the area altogether. This might be a great trading opportunity to keep an eye on.
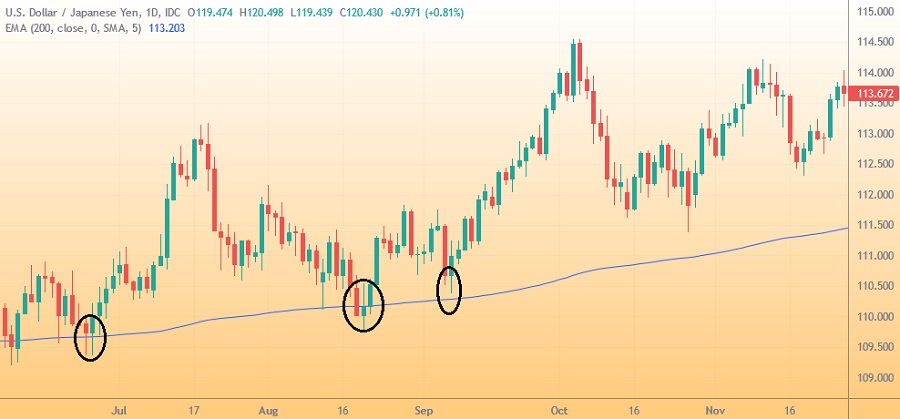
The chart above shows that the overall trend is bullish. The price fluctuated here and there, but you can see that there are several clear trading opportunities to enter the market when the price bounces off of the 200 EMA line. Keep in mind that this may not be the strongest signal for an entry, so it is crucial to have a good risk management system and use several indicators to further confirm the signal.
Which is the Best Time Frame to Use?
Essentially, the 200 EMA can be used in any time frame you wish, ranging from a 1-minute chart to the weekly one. However, the effectiveness may vary depending on what strategy you use. Since we're talking about position trading, the most recommended time frame would be daily and weekly. In technical trading, it's usually better to use multi time frame analysis so that you can analyze the chart from several different perspectives and find the best trading opportunity.
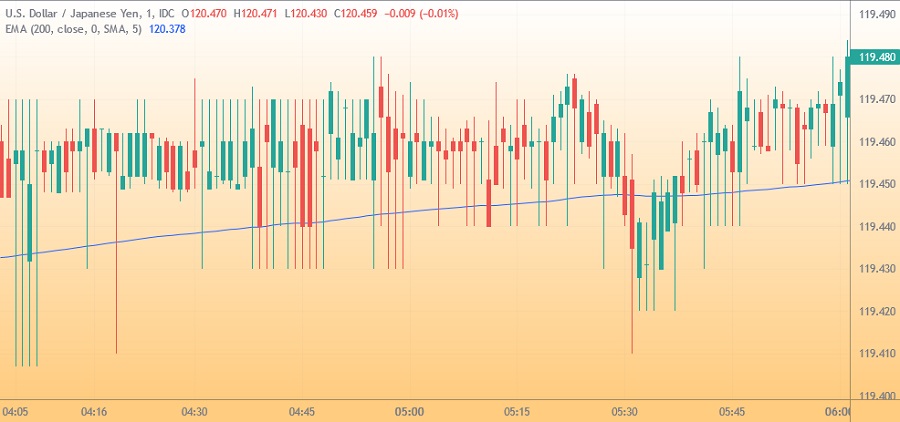
Here's an example of using 200 EMA in a 1-minute chart. You could probably tell that the chart is pretty hard to analyze because the price changes too often. This could still be useful in some cases, but it is definitely not suitable for long-term traders because they shouldn't care much about such small movements unless it affects the overall long-term trend.
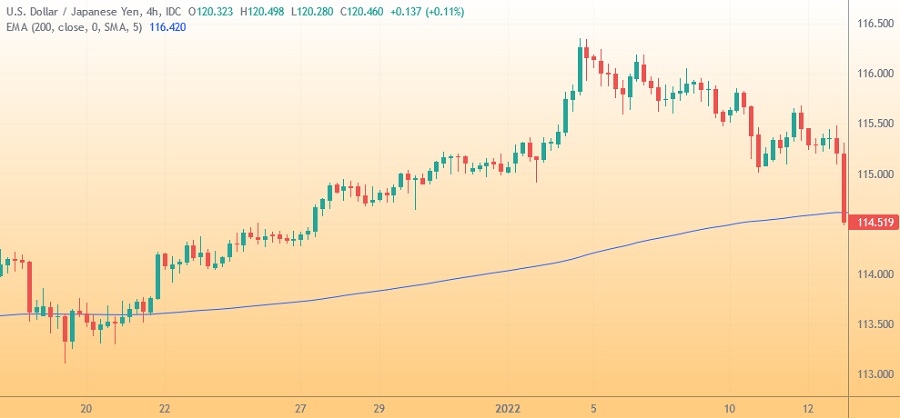
On the other hand, the chart below shows the use of 200 EMA in a 4H chart. As shown, the chart presents a clearer and smoother 200 EMA line, so you can easily spot that the directional bias is bullish.
The higher the time frame used in your trade, the smoother the 200 EMA. So, even though the 200 EMA works in practically any time frame, you need to choose the best time frame that suits your trading style. In this case, you would want to use higher time frames like daily and weekly charts in order to take profit as a position trader.
The Bottom Line
Position trading is a popular strategy used by many forex traders worldwide. Since it's a long-term approach, then you also need to use indicators or trading tools that support long-term analyses. One of the best options is to use the 200 EMA. Another thing that you need to consider is the time frame that you use to analyze the price movements. Remember that as a position trader, you should focus more on big price movements instead of worrying about short-term price fluctuations. Therefore, higher time frame charts would be more suitable.
In reality, the market is less predictable than it seems and those principles may not always work in every single trade, but it's still highly useful to help you avoid getting caught in the wrong side of the market.


5 Comments
Jessica
Apr 11 2022
Can the 200 EMA be used independently without other indicators?
Ternier
Jun 10 2023
@Jessica: Yeah, it can also it cannot. Although, it's a pretty popular indicator among traders. Some people swear by it and use it all on its own, while others prefer to combine it with other indicators. So, can you use the 200 EMA by itself? Well, technically, yeah, but it not so good at all.
Here's the deal: the 200 EMA is a long-term moving average that smoothes out price data over, you guessed it, 200 periods. It's kind of like a trend line that shows you the general direction of the market. If the price is above the 200 EMA, it's typically seen as a bullish sign, indicating an uptrend. And if it's below, it's seen as bearish, suggesting a downtrend.
Some traders use the 200 EMA as a support or resistance level. So, during an uptrend, if the price pulls back to the 200 EMA, it can act as a support level, which means it might be a good time to buy. And during a downtrend, the 200 EMA can be a resistance level where you might want to consider selling.
Relying solely on the 200 EMA might not be the best idea. It's always a good idea to use it in combination with other indicators or chart patterns to confirm your trading signals. That way, you increase your chances of making accurate trades, ya know?
Peter
Jul 6 2023
Hey there! Can beginners engage in position trading as a long-term forex trading strategy? While position trading involves holding trades for an extended period, it may seem appealing to those who prefer a more relaxed approach. However, are there any specific considerations or challenges that beginners should be aware of before venturing into position trading? How can beginners identify and follow long-term trends effectively? And what are some key factors to consider when deciding on entry and exit points in position trading?
Sandy
Jul 7 2023
@Peter: Hey there! So you're curious if beginners can jump into position trading as a long-term forex strategy, right? Well, the answer is yes, they can! Position trading is great for those who prefer a more laid-back approach. But before you dive in, here are a few things to keep in mind.
First off, get a good grip on fundamental and technical analysis. Spotting long-term trends is crucial for successful position trading. Keep an eye on economic indicators, news events, and market sentiment to identify those trends.
Don't forget about risk management! Have a solid plan, set stop loss levels, and be smart about position sizing. Remember, position trades can have bigger drawdowns, so risk management is a must.
To nail those entry and exit points, use technical indicators like moving averages, trendlines, and support/resistance levels. And hey, consider trailing stops or profit targets to lock in profits and protect against reversals.
Lastly, stay patient and don't let short-term noise sway you. Position trading requires a long-term mindset.
Brandy
Jul 9 2023
How can beginners get started with position trading in the forex market? Position trading involves taking long-term positions in the hope that the price will increase over time. Unlike day traders who focus on short-term price movements, position traders take a broader perspective and pay more attention to long-term price changes. For beginners interested in position trading, what strategies or tips would you recommend they consider? Should beginners aim to open only a few trades per year, similar to experienced position traders, or is there flexibility in the number of trades? Are there any indicators or tools that beginners can use to identify potential entry and exit points for their position trades? Lastly, what are the benefits and potential challenges that beginners may face in position trading, and how can they effectively manage risks while pursuing this trading style?