 Dedicated FREE FOREX VPS
 Free FOREX Virtual Private Server
 MT4 Demo Contest, Get $500
 Sign Up for an Account, Claim 60% Deposit Bonus
 Free MT4/MT5 VPS 2024
 Send E-mail and Get Free Merchandise
 $1K Refer a Friend Bonus for Pepperstone Pro clients
 Maximize Your Earnings with 100% Deposit bonus
 Trade to Win, $5,000 Monthly Demo Contest
 Claim 30% + 15% Deposit Bonus from LiteFinance
Flag patterns are some of the easiest yet powerful chart patterns to check out. Learn how to identify and use them for your trades in this article.
There are countless strategies to try if you wish to earn profit in online trading. The market may look random and highly unpredictable at first glance, but it's actually not. Instead of just relying on your instincts to trade and risk losing money, you can use technical analysis to help you study price movements and how to use them in your favor. The idea is to look at past price movements, analyze the current trading conditions, and use them to catch opportunities. Many traders believe that the price can tell you everything that's happening on the market.
One of the most straightforward yet powerful chart patterns is flag patterns, formed when the price consolidates in a narrow range after making a sharp move. They can indicate price action for entry, stop loss levels, and targets.
Contents
What is a Flag Pattern?
Flag patterns are candlestick formations that are pretty easy to recognize. In the context of technical analysis, a flag refers to a pattern that moves in the opposite direction of the current trend. It earns its name due to the flag-like shape it bears. Basically, the pattern started off with a sharp line as the pole and a connected sloping rectangle shape as the flag. The flag part of the pattern should occur between two parallel lines and can either be slanted upward or downward.
Flag patterns often appear when the trend is strong to indicate trend continuation. When the price breaks from the pattern, it tends to move back in the direction of the prior trend. The resuming trend usually moves in a swing so strong it can create a great opportunity to earn huge profits. It's often described as a break from a significant market move. Some traders also think that this is a period where market makers take their breaths before resuming their journey.
How to Identify Flag Patterns
Flags are formed when there's a tight consolidation in price action showing a counter-trend move after a sharp directional movement. The patterns usually consist of around five to 15 price bars. They can either be upward (bullish flag) or downward (bearish flag). The bottom of the flag should not hit the midpoint of the flagpole. There are five elements in a flag pattern to watch:
- The ongoing trend
- The consolidation channel
- The volume pattern
- A breakout
- A confirmation where the price moves in the same direction as the breakout
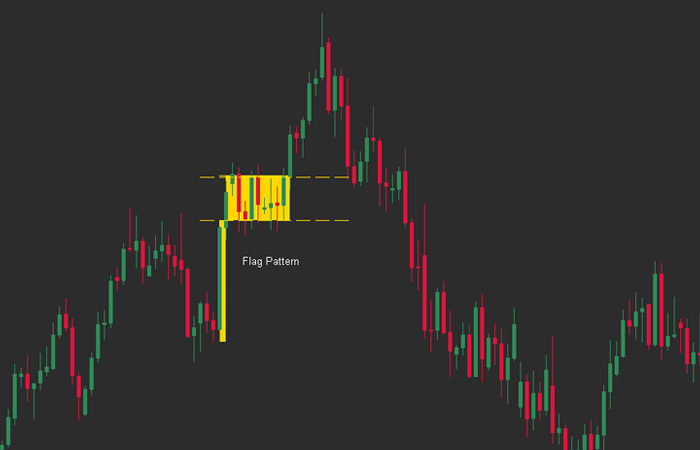
Here's an example of a flag pattern:
To quickly identify a flag pattern on a price action chart, look out for these conditions:
- A strong trending move, shown by large body candles.
- The subsequent weak pullback, shown by small-bodied candles.
Keep in mind that not all flag patterns are equally strong. Ideally, the pole must be a sharp move, nearly vertical, and noticeably longer and swifter than the price before it. Such a swift and abrupt movement basically show that there's a strong buying or selling action going on. This is the action used to trade a breakout from the following flag formation.
On the other hand, patterns with flags that are angled in the same direction as the pole are considered weak. Instead, you would want to see a sharp pole, followed by a flag moving in the opposite direction. So if the pole is moving sharply upwards, the flag should angle down, whereas the pole that is moving sharply downwards should be followed by an upward flag.
Another important thing is that flag patterns are often mistaken to be the same as pennant patterns when the two are actually different. While the shapes are mostly identical, the consolidation phase of a pennant pattern is characterized by converging trend lines rather than parallel lines. Put it simply, the flag in flag patterns is a perfect rectangle while pennant is a triangle.
When is the Best Time to Trade Flag Patterns?
While flag patterns can technically occur at any time, but there are primarily two best times to spot flag patterns:
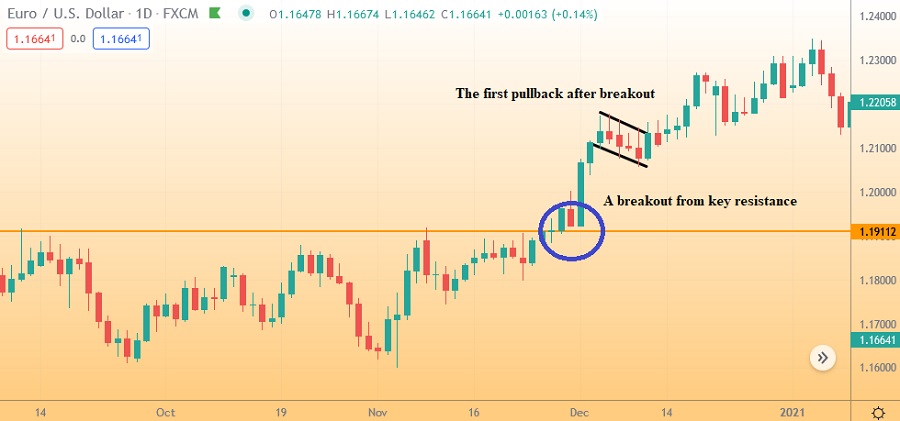
1. When the Market Just Had a Breakout
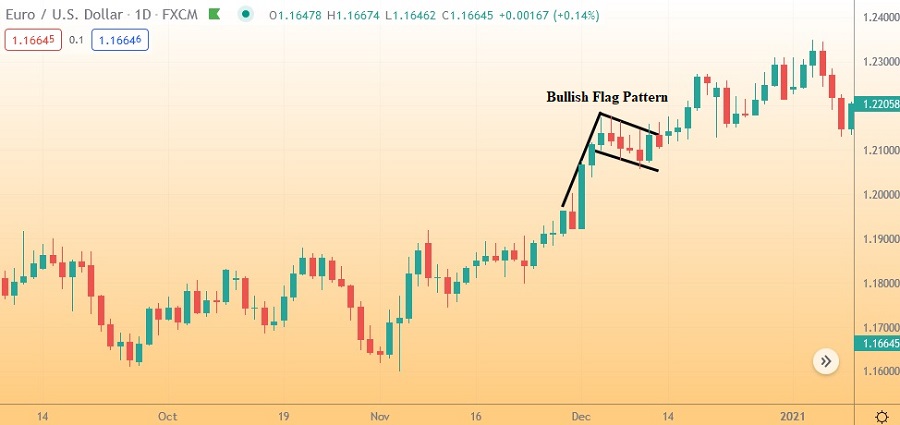
Typically, a bullish flag pattern appears when the market is in an uptrend, followed by a subsequent breakdown. When there's a breakdown, there's a high chance that you're going to encounter a flag pattern on the first pullback. Once you see a downward flag forming after a sharp rise on the chart, it is the best time to trade with a flag pattern. This is because traders who missed the move will be waiting for a pullback.
Following the pattern is usually the continuation of the prior trend because traders who have missed the earlier movements are trying to catch the trend. Take a look at the example below.
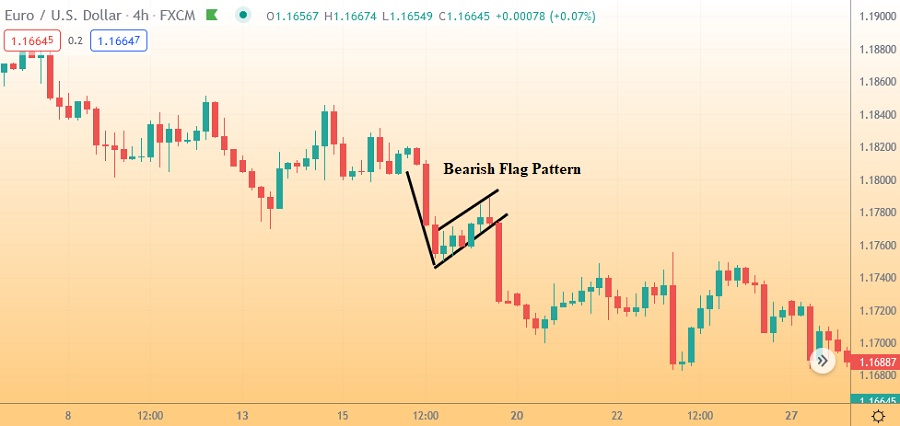
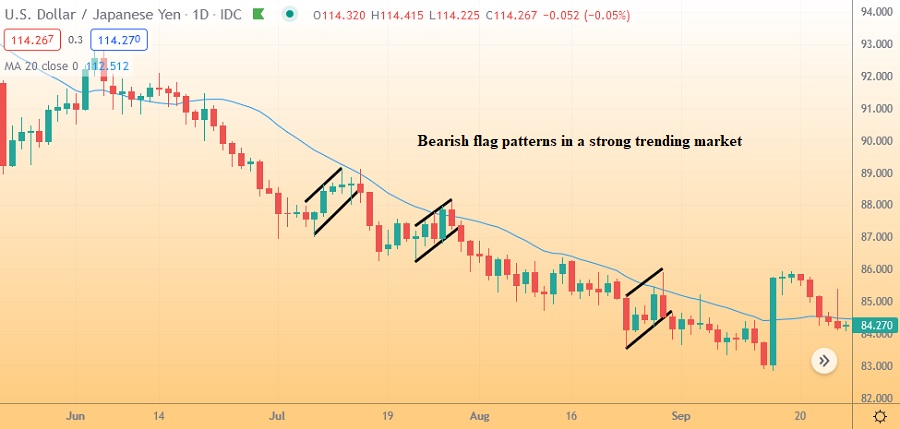
2. Strong Trending Market
The second ideal situation for trading with flag patterns is when there's a strong trending going on. If the market's trend is moving intensely along with the 20-period moving average or more, there's a high chance of a pullback in the form of a flag pattern.
How to Trade Flag Pattern
-
Entry: You must wait until a breakout occurs in the flag part. Entry position can be done by placing a pending order or waiting for a candle to close after the breakout.
-
Stop Loss: In flag pattern trading strategy, you can place the stop loss 1 ATR below the low level or above the high level of the formed flag. Set the stop loss on the low part during an uptrend, and place the stop loss on the high part during a downtrend.
-
Profit Target: High profit is one of the benefits of using flag patterns. In this case, there are two methods that you can use to determine your profit targets:
-
Aggressive, which likely results in quick profits. This method is based on the distance between the parallel lines of the flag. Let's say the flag is 20 pips wide, then the profit target should be more or less than 20 pips, depending on the direction of the breakout. As the market is tightly wound after a strong move, these targets are pretty easy to hit.
-
Conservative, tend to take longer but results in higher profits. This method is based on the pole, in which the length of the flagpole is measured from the start to the tip of the flag. The result should be your profit target.
-
-
Exit: Flag pattern is all about using the trend and riding it because they typically occur right after a short breakout or during a strong trending market. For the exit, you can either use a moving average to trail your stop loss. Or as the market creates new higher highs and higher lows, you can just trail it by using the previous low.
See Also:
Conclusion
Flag patterns are some of the most commonly used chart patterns in trading. Flags are indicated by a sharp price movement that is followed by a short counter-trend consolidation that runs between parallel lines. It is a continuation pattern that can either be bullish or bearish. The best time to trade with flag patterns is when the market trend has enough momentum to go on.
The only drawback with flag patterns is a false breakout. When this occurs, it's best to cut your loss quickly and don't wait for the stop loss to get hit. It will help minimize the loss and give you time to prepare for the next breakout. In addition, it would also be helpful to combine this pattern with other technical indicators such as Moving Average or Fibonacci retracement.