By following the steps that will be explained here, you should be able to confirm the direction of trend lines and profit from it.
In this article, I will discuss how to trade with trend lines using technical indicators. We also discussed the trend's strength in the last article, and by following the steps explained here, you should be able to confirm the trend's direction.
How to Draw a Trendline
Drawing a trendline and interpreting signals on it can be helpful in technical analysis to identify trends and potential trading opportunities. Here's a step-by-step guide on how to draw a trendline:
- Identify the trend: Look for a clear and sustained price movement in either an uptrend or a downtrend. An uptrend consists of higher highs and higher lows, while a downtrend consists of lower highs and lower lows.
- Choose anchor points: Select two significant points on the chart that defines the trend. Choose a swing low (a low point) and a subsequent higher swing low for an uptrend. For a downtrend, select a swing high (a high point) and a subsequent lower swing high.
- Draw the trendline: Use a straight line tool or a line connecting the two anchor points. Ensure the line touches as many relevant price points as possible without excessively deviating from the trend.
- Confirm the trendline: Extend the trendline into the future to see if it continues to align with subsequent price movements. If the line consistently intersects with significant price points, it confirms the validity of the trendline.
How to Use Trendline for Analysis
Interpret signals on the trendline: Once the trendline is drawn, you can analyze the signals it provides:
- Bounces: When the price approaches the trendline and bounces off it, it indicates support or resistance. In an uptrend, the trendline acts as support, while in a downtrend, it acts as resistance. These bounces suggest potential entry or exit points for trades.
- Breakouts: If the price breaks above an uptrend line or below a downtrend line, it may signal a trend reversal or a continuation of the existing trend. Traders often consider breakouts as potential trading opportunities.
- Slope and angle: The steepness of the trendline can provide information about the trend's strength. A steeper angle suggests a stronger trend, while a flatter angle may indicate a weakening trend or consolidation.
Remember that trendlines are not infallible and should be used with other technical indicators and analysis methods to make well-informed trading decisions. Additionally, practicing and validating your analysis through real-time market observations and historical data is crucial.
See Also:
Technical Signals
1. The Average Directional Index (ADX)
You may have heard about this indicator; ADX determines the trend direction and strength. However, this indicator also lags and is difficult to use as a reliable tool on price charts. The ADX signals whether or not the market is trending. Values above 30 indicate a strong signal, while values under 20 demonstrate either a weak or no trend. 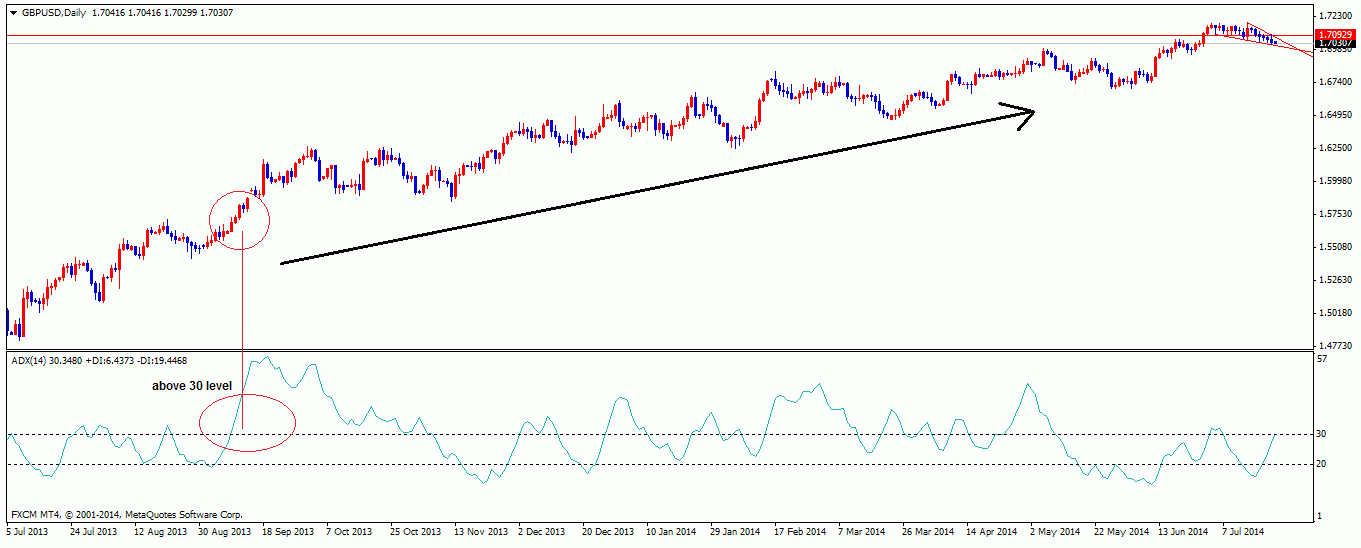
2. Stochastic
Stochastic is one of the most popular indicators, comparing closing prices to the high-low range within a particular time frame. Stochastic uses two different lines (%K and %D). These lines show readings of values in which over 80 signal strong upward movement, and readings less than 20 represent strong downward movement. After determining the trend's direction, confirm it is using the slope of the 'Slow Stochastic,' indicating the trend's momentum. An uptrend will slope strongly upward, while a downtrend will slope strongly downward.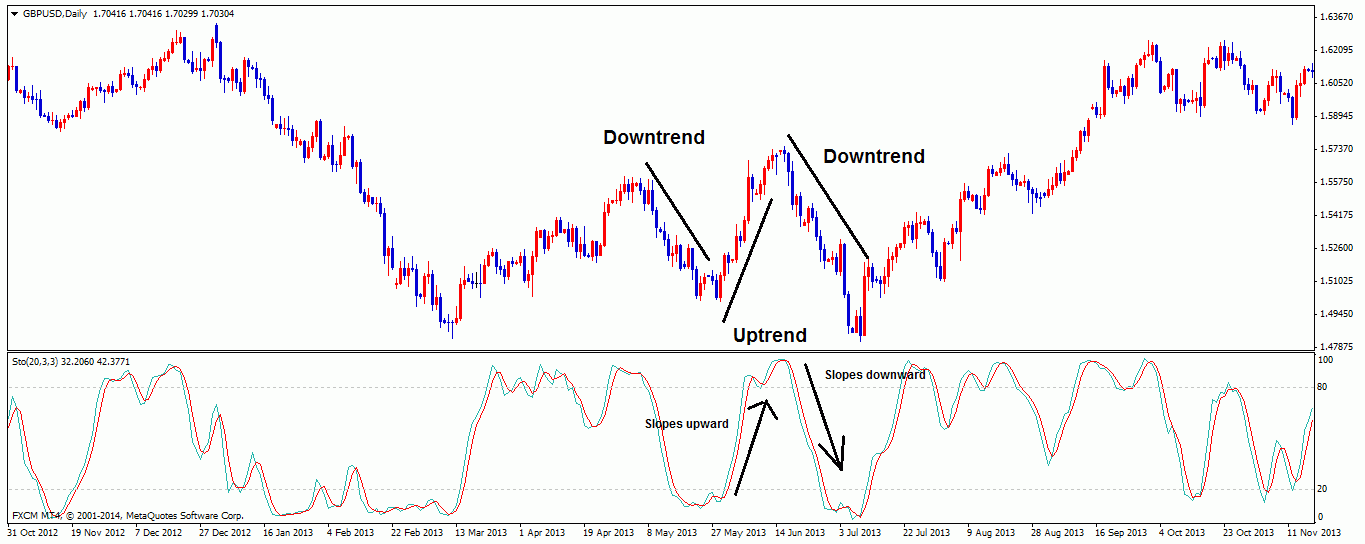
Technical Execution of the Strategy
Combining trendlines with technical indicators like the Average Directional Index (ADX) and Stochastic oscillator can help identify potential trading opportunities.
Here's a general approach to trading using these tools:
- Identify the trend using trendlines: Draw trendlines as explained in the previous response to determine the overall trend direction. Focus on higher timeframes (e.g., daily or weekly) for a clearer perspective.
- Confirm the strength of the trend with ADX: The ADX indicator helps assess the strength of a trend. A high ADX reading suggests a strong trend, while a low ADX reading indicates a weak or range-bound market. Look for ADX values above 25 or 30 to confirm a significant trend.
- Analyze Stochastic oscillator for overbought/oversold conditions: The Stochastic oscillator is a momentum indicator oscillator between 0 and 100. It helps identify potential reversal points. In an uptrend, look for the Stochastic to become overbought (above 80) and then cross below the 80 levels. Watch for the Stochastic to become oversold (below 20) in a downtrend and then cross above the 20 levels.
- Seek trading opportunities at trendline bounces and indicator confirmations: Once you have identified a trend using the trendline and confirmed its strength with the ADX, look for potential entry points when the Stochastic aligns with the trend. For example: In an uptrend, if the price bounces off the trendline and the Stochastic crosses below 80 from overbought territory, it may indicate a potential selling opportunity. In a downtrend, if the price bounces off the trendline and the Stochastic crosses above 20 from oversold territory, it may suggest a potential buying opportunity. These combinations of trendline bounces and indicator confirmations can help you time your trades more effectively.
- Set stop-loss and take-profit levels: To manage risk, set appropriate stop-loss levels below support or above resistance levels. Determine your take-profit targets based on your risk-reward ratio and other technical analysis factors.
- Monitor the trade: Once you enter a trade, monitor its progress. If the price moves in your favor, you can consider trailing your stop-loss to protect profits. Additionally, monitor the ADX and Stochastic indicators for signs of trend weakening or potential reversals.
This is an example of trading using the method described above:
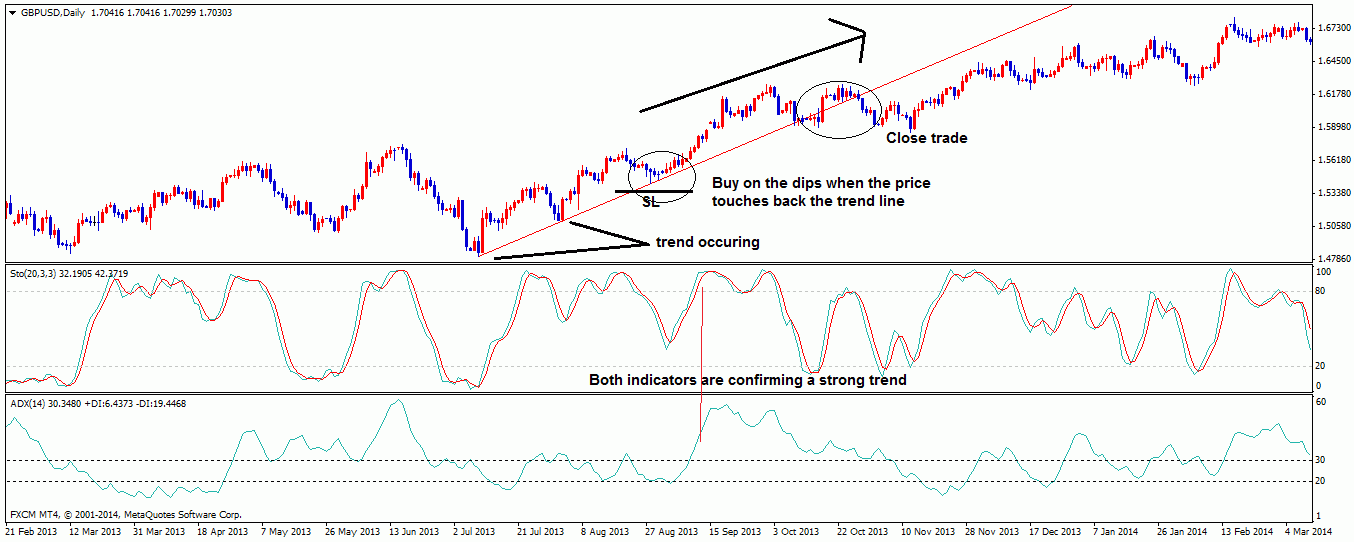
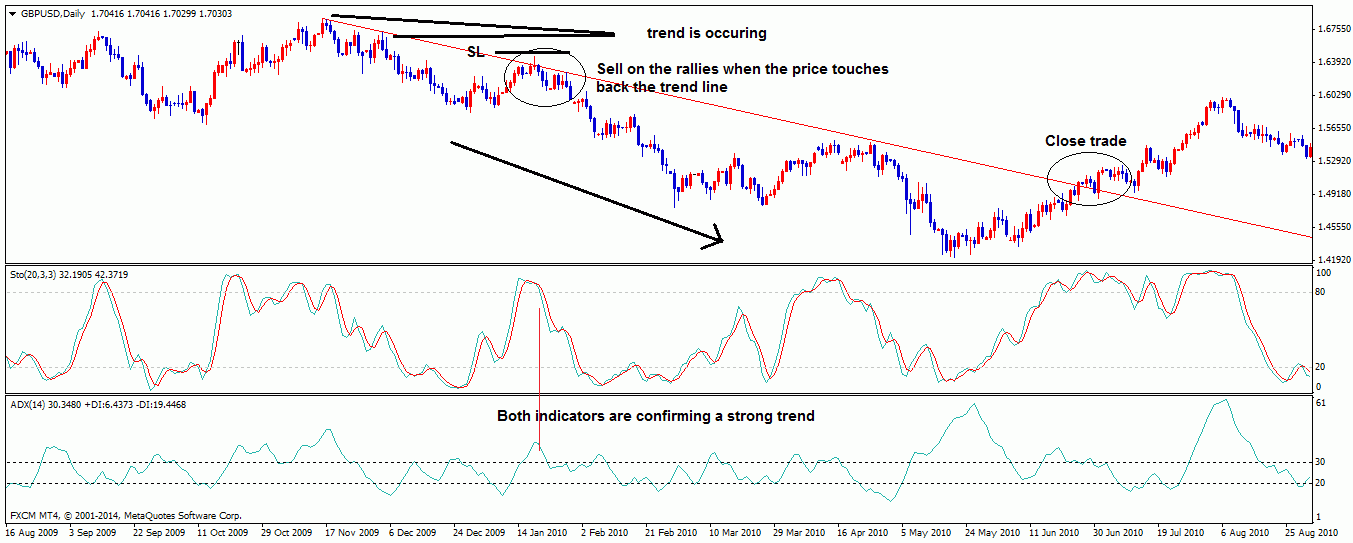
Here are some additional tips for trading using trendline combined with ADX and Stochastic for forex:
- Use multiple time frames to confirm the trend.
- Consider the volatility of the market before entering a trade.
- Use a stop-loss order to protect your profits.
- Practice trading with a demo account before using real money.
It is important to remember that no trading strategy is perfect and that there is always the risk of losing money. Remember, trading involves risks, and it's important to conduct a thorough analysis, consider multiple indicators, and practice proper risk management techniques. Additionally, this approach should be used as a starting point and tailored to your trading style, preferences, and risk tolerance.

 Dedicated FREE FOREX VPS
 Free FOREX Virtual Private Server
 MT4 Demo Contest, Get $500
 Sign Up for an Account, Claim 60% Deposit Bonus
 Free MT4/MT5 VPS 2024
 Send E-mail and Get Free Merchandise
 $1K Refer a Friend Bonus for Pepperstone Pro clients
 Maximize Your Earnings with 100% Deposit bonus
 Trade to Win, $5,000 Monthly Demo Contest
 Claim 30% + 15% Deposit Bonus from LiteFinance


