 Dedicated FREE FOREX VPS
 Free FOREX Virtual Private Server
 MT4 Demo Contest, Get $500
 Sign Up for an Account, Claim 60% Deposit Bonus
 Free MT4/MT5 VPS 2024
 Send E-mail and Get Free Merchandise
 $1K Refer a Friend Bonus for Pepperstone Pro clients
 Maximize Your Earnings with 100% Deposit bonus
 Trade to Win, $5,000 Monthly Demo Contest
 Claim 30% + 15% Deposit Bonus from LiteFinance
There are two essential ways to read the forex market: fundamental or technical analysis. Many traders only lean towards one, but some combine the two.

Traders explore profit opportunities in the forex market by evaluating the current market conditions. When noticeable price fluctuations occur, traders strategically place orders to capitalize on potential profits.
Consequently, a forex trader needs the essential skill of accurately interpreting market dynamics. How is this achieved?
Essentially, there are two approaches or methods to analyze the forex market:
- Fundamental perspective
- Technical chart
The fundamental way entails keeping a keen eye on economic conditions that influence market movements. Conversely, the technical way involves scrutinizing price trends on trading charts, utilizing indicators, and interpreting candlestick patterns.
To gain a more comprehensive understanding, let's delve more deeply into these aspects.
Reading the Forex Market through Fundamentals
Fundamental analysis is the analysis of currency movements based on economic data and the political conditions of a country. Depending on how you carry out the analysis, you can generate different types of forex market readings with fundamentals.
1. Economic Phases
This fundamental analysis would assist you in reading the forex market in four phases known as the economic cycle: Contraction (Recession), Slump (Through), Expansion (Recovery), and Boom (Peak).
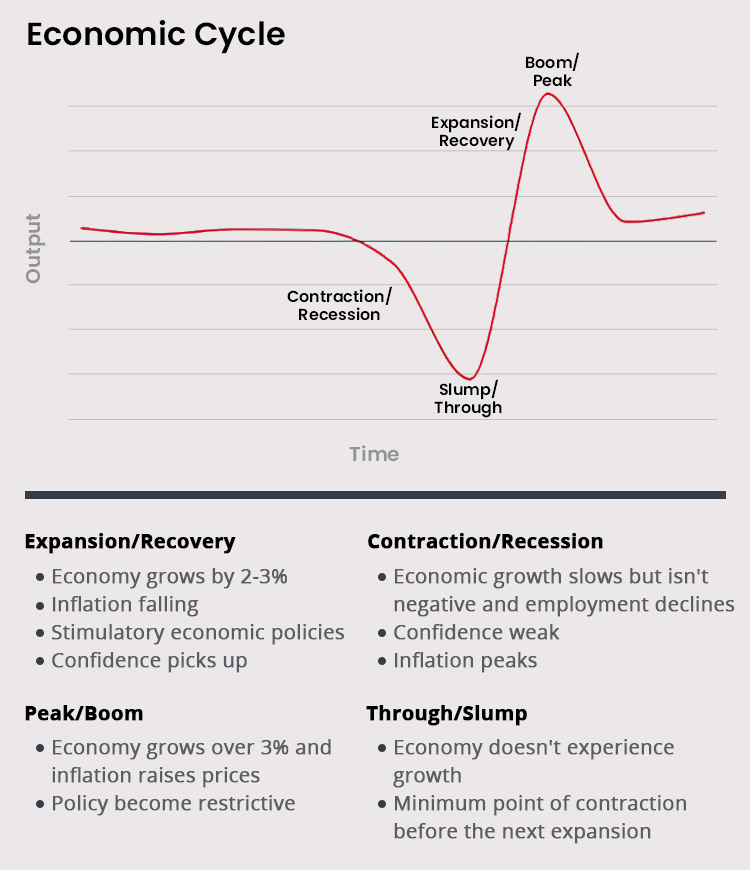
To determine which phase a country is indicating, several factors can be observed, such as Gross Domestic Product (GDP) data, the unemployment rate, industrial production, and the Consumer Price Index (CPI) for inflation.
For example, consider the data on the following economic calendar.
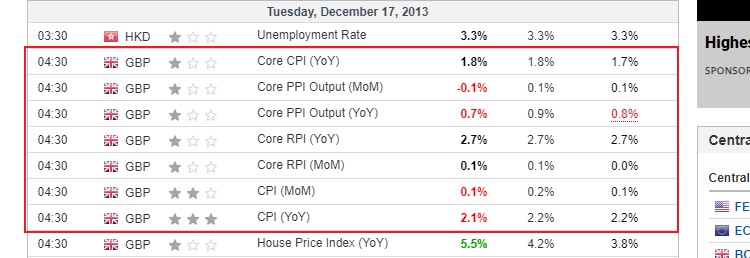
It appears that the UK CPI showed a decline, where the yearly CPI failed to meet the forecasted number. However, don't rush to conclude that the UK's inflation indicated a negative outlook in the economy. There was still a possibility that the decline was seasonal or a one-time anomaly. As such, it would be wiser to seek confirmation first from the following UK inflation history chart.
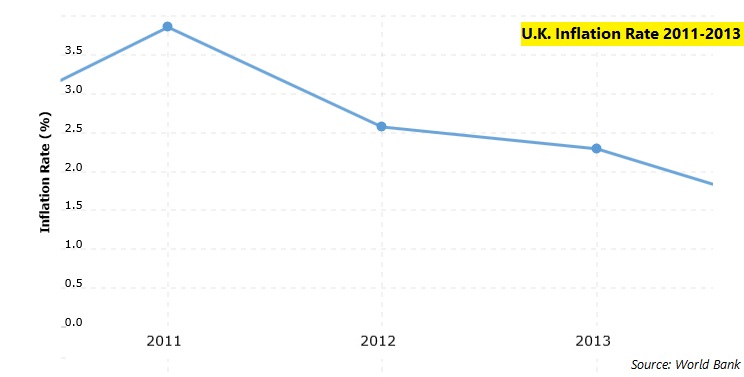
From the chart above, it was clear that inflation in the UK had been declining consistently for the previous two years. This was a good confirmation that the slump in the calendar release was not a random occurrence but rather continuing a downward trend that was concerning to the economy. It surely weighed on the Sterling as the United Kingdom may be experiencing an economic slowdown.
So, What to Do?
- When the global economy is at the end of the Recovery phase and the beginning of the Peak phase, risk appetite increases:
- Sell currencies with strong fundamentals and low interest rates.
- Buy currencies with high interest rates, even if their fundamentals are weak.
- When the global economy experiences a Recession and Slump phase, risk appetite decreases:
- Sell currencies with weak fundamentals, even if they have high interest rates.
- Buy currencies with strong fundamentals, even if they have low interest rates.
2. Monetary Outlooks
Generally, central bank monetary policies can be categorized into three types that can be referred to as market readings:
- Hawkish: tends towards tightening monetary policy. Tight monetary policies after the peak period signal the beginning of the next economic cycle, which is positive for the currency. Investors tend to be bullish in this condition.
- Dovish: leans towards loosening monetary policy. Loose monetary policies after a recession period are considered normal, but due to their nature of adding money supply to the market, investors usually choose to sell the currency during this situation.
- Neutral: tends to maintain existing policies without significant changes. It doesn't really affect the way investors make decisions, so there's no significant follow-up to the market sentiment toward the currency.
Reading the Forex Market through Technicals
In the context of technical analysis, reading the market is the process of observing the movements in a chart. Some of the most popular ways to technically read the market are as follows:
Understanding Candlesticks
In reading charts, one cannot escape from understanding candlesticks. A candlestick is a graphical representation of price movements. Each candlestick provides information about the opening, closing, high, and low prices for a specific period, such as one minute, one hour, or one day—depending on your time frame setting.
The anatomy of a candlestick consists of a body and shadows. The body represents the opening and closing prices, while the shadows indicate the lowest and highest prices.
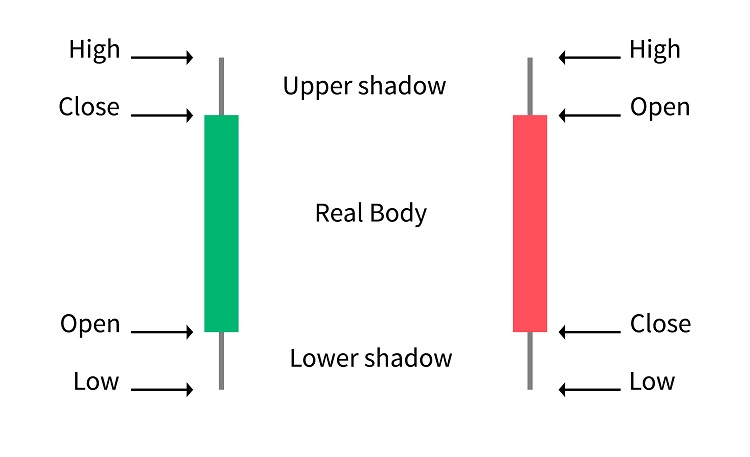
Red candlesticks represent a bearish movement in which the closing price is lower than the opening. Conversely, green candlesticks signify a bullish movement as the closing price is higher than the opening. The color may vary depending on the settings of the trader's platform.
Understanding the Market Trend
In one chart, you undoubtedly see not just one candlestick but many of them lining up to show various ups and downs. You can observe the ongoing trend in the forex market by examining the placement of these candlesticks. If the candles are mostly green and tend to rise, then the price is bullish; if they are dominated by red and descending, it indicates a bearish trend.
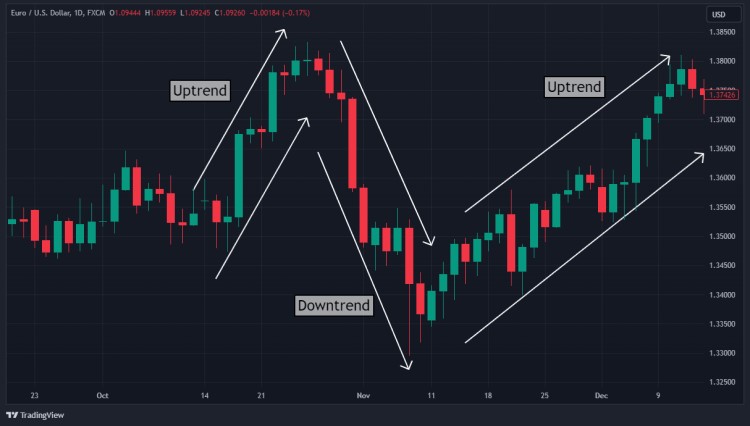
From there, you can determine support and resistance to find bounces and breakouts. Breakouts occur when the price moves above the resistance or below the support. Meanwhile, bounces are when the price fails to pierce the support or resistance so it tends to move back to its previous direction.
Understanding Technical Indicators
Technical indicators are mathematical calculations based on historical price, volume, or open interest data. They are used by traders and analysts to understand market trends, identify potential entry or exit points, and gauge the overall strength or weakness of a financial instrument.
Make use of various indicators to assist in your chart analysis. The most commonly used indicators are:
- Moving Averages
- Relative Strength Index (RSI)
- Stochastic Oscillator
- Bollinger Bands
- MACD (Moving Average Convergence Divergence):
- Fibonacci Retracements
- Ichimoku Clouds
- Average True Range (ATR)
- Parabolic SAR
Here's an example of how to read the market with one of the technical indicators above (Moving Average):
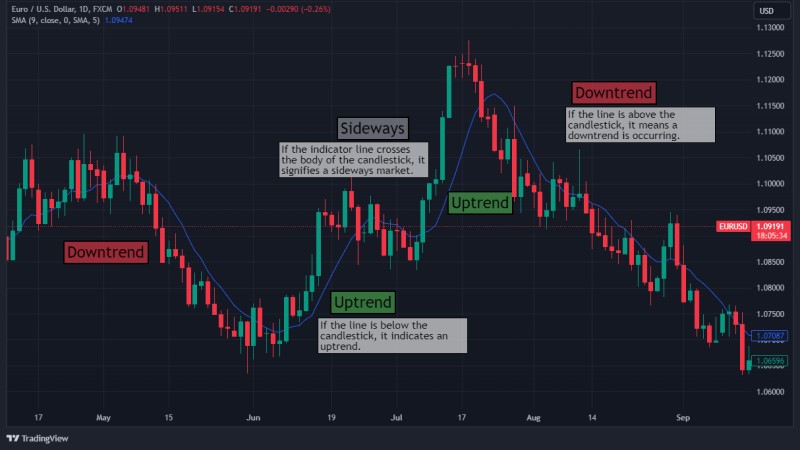
Different indicators generate different signals and visuals, so the ways to read them also vary. You can learn all about it in Leading Vs Lagging Indicators in Forex Trading.
Bottom Line: Fundamental or Technical?
There is no one way better than the other. All approaches can provide a similar overview of the forex market. What distinguishes them is only the approach used.
Reading the market using fundamentals means you are observing changes in the prices of forex pairs based on the economic situation while reading the market through technical charts means you pay attention to price movements by interpreting specific shapes or patterns visible on the trading chart.
You can even use both to get a more comprehensive picture. For example:
In the economic calendar, there will be a release of the Eurozone's GDP. The market anticipates economic growth, and there is a bullish fundamental signal for the Euro.
Switch to the EUR/USD chart. Suppose you notice a double-bottom pattern forming on the daily chart that indicates a bullish reversal, apply technical indicators like MA or Relative Strength Index to confirm the signal and buy the currency pai.
If the economic data continues to support a strong Euro and the technical pattern unfolds as expected, the combined analysis reinforces your confidence in the trade.


4 Comments
Alvonso Borowiecki
Jun 6 2014
It's hard to understand the fundamental analysis. I prefer using technical analysis, it is lots faster and simple.
Daniel Robson
Jun 21 2014
An experienced trader will usually use a combination trading strategy, which combines technical and fundamental analysis in order to obtain a profitable entry position.
Jason Smith
Aug 10 2014
I am on your side. It doesn't make sense if we trade using one type of analysis. I have been realized after a year of trading forex and I used to trade only using technical analysis. But, the loss hits me harder and forces me to learn how to trade deeply. Then, one of my trader friends recommends me to learn both of them.
My suggestion is If you want to combine the two analyzes, it is best if we know the schedules/news releases that will be released on that day, how the effects of the news release are, then look for points of similarity between the two analyzes. However, you need to anticipate that even if it is potentially positive, the results of fundamental analysis can be the opposite. Likewise with technical analysis.
Alvonso Borowiecki
Aug 30 2014
Wow, thanks a lot guys. Yeah, you're right...maybe I got wrong with my view about fundamental analysis and I never been using it. But now I know, I have to change my view and start considering to learn fundamental aspects. Nice share guys.