Dedicated FREE FOREX VPS
 Free FOREX Virtual Private Server
 MT4 Demo Contest, Get $500
 Sign Up for an Account, Claim 60% Deposit Bonus
 Free MT4/MT5 VPS 2024
 Send E-mail and Get Free Merchandise
 $1K Refer a Friend Bonus for Pepperstone Pro clients
 Maximize Your Earnings with 100% Deposit bonus
 Trade to Win, $5,000 Monthly Demo Contest
 Claim 30% + 15% Deposit Bonus from LiteFinance
Just as there are dozens of ways to analyze the market; there are many ways to find the perfect timing for entry and exit. Here are some of them. You can give these some consideration and shape it to your style.

The previous article mentioned that the entry and exit strategy is very important. The first thing that will determine the success of a trade is the trader's perfect timing at entering and exiting the market. Now, the question is, how to do it? Just as there are dozens, or even hundreds, of ways to analyze the market, there are many ways to find the perfect timing for entry and exit.
To enter the market, you can use the following strategy:
- MA Crossover: Using two MAs to find the best entry position.
- Fibonacci Retracement: Powerful indicators to help you find entry points.
- Divergence: A non-trend following strategy used by observing price movement.
You can consider these and shape them to your style, or try out other forex entry and exit strategies to find your 'significant other'. How to utilize them?
Enter The Market
Let's learn how to enter the market:
1. MA Crossover
Our personal favorite among the many entry strategies is Moving Averages (MA) Crossover. In a previous article, we have shown you how to use EMA-20 and EMA-60 Crossover. When EMA-20 line cut EMA-60 line in its way upward, it might be time to open long position. While when EMA-20 line cut EMA-60 line in its way downward, it might be time to open short position. For a clearer picture, see the screenshot below.
 EMA-20 (Red) And EMA-60 (Blue) Crossover On GBPUSD M15 Chart
It was not a perfect signal, as you will soon know when you tried it out in demo account; it was only right at about 80% of times when the market is trending, and could be a complete failure at the ranging market. However, you can use it along with MACD or Average Directional Index (ADX) to know the strength of an emerging MA crossover signal.
As MA Crossover is practically only good at detecting entry points, MACD or ADX will also be very useful to help you determine when to exit the market. For example, you could sell a pair when crossover occurs, and close it after seeing that MACD has overstayed its welcome at the lower area. Or else, you could observe the movement of the lower MA line; if it has stagnated for some time, get out of there.
2. Fibonacci Retracement
Fibonacci retracement is well-known as an extremely powerful indicator. Its main feature is its ability to point out levels at which pullbacks and reversals are triggered. Therefore, forex traders surely will be able to use it as entry, as well as exit strategy.
 Wisopivot Based On Fibonacci Retracement
To further increase the accuracy of your entry, you could combine Fibonacci Retracement with a little bit of candlestick analysis. It will be good if you have mastered candlestick pattern analysis, but even if you do not, you should still be able to use it if you know a couple of key reversal signals depicted by candlestick formation, such as doji.
3. Divergence
Another favorite among our team is divergence, a non-trend following strategy used by observing price movement on the chart and several indicators simultaneously. The indicators used to spot divergence could be a combination of MACD and Stochastic, or RSI and CCI, or others.
When there is a divergence between the direction of price movements and what is indicated by the indicators, it means that there is a chance to enter the market. To ensure the strength of the signal, traders could check on different timeframe to see if there is another divergence in lower or higher timeframe.
 A Bullish Divergence On GBPUSD 4H Chart
A bullish divergence happens when the price moves in a downtrend and a bearish divergence happens when the price moves in an uptrend. Divergence could be a very powerful entry strategy depending on the strength of the signal that emerged.
Exit Trades
This is what you need to prepare to exit a trade:
1. Trailing Stop
The trailing stop is highly effective for managing profitable trades, providing traders with real-time position protection as the market moves. Similar to a regular stop loss, the trailing stop allows traders to define their acceptable risk parameters. However, what sets it apart can dynamically adjust as the market price of the traded asset changes.
The stop loss level moves with the market when using a trailing stop. For instance, let's consider a scenario where a trader buys GBP/USD with an initial stop of 50 points and a trailing stop of 50 points.
As the price of GBP/USD increases, the trailing stop will "trail" or move higher accordingly. For instance, during last week's rally, if the GBP/USD reached a high of 0.7712, the trailing stop would be adjusted to 0.7662. If the price fell below this level, the trade would automatically exit, safeguarding the profits attained.
2. Support and Resistance
Support and resistance levels are known for their ability to impede price movements and act as launching pads for further extensions in price. Ultimately, support and resistance is also popular exit point indicators.
By implementing support and resistance trailing stop, traders can logically trail their stop-loss order behind the market, effectively safeguarding their profits as the price continues to move in their favor. This strategy enables traders to capitalize on the psychological significance of support and resistance levels while maintaining a protective measure for their gains.
3. Price Action
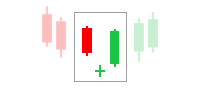
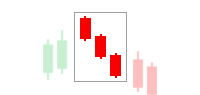
This exit strategy revolves around observing price action. For instance, to find the best exit you may identify candlestick reversal patterns that signify a potential trend reversal or weakening. Some candlestick reversal patterns include Three White Soldiers, Three Black Crows, Morning Star, Evening Star, and many more.
These patterns serve as valuable indicators, guiding you in deciding when to exit a trade and lock in your profits. By attentively monitoring price action and recognizing these patterns, you can enhance your trading outcomes and navigate the market more precisely.
Exit Can Be Tricky
Exiting trades often present psychological dilemmas on traders. When open trades have floated for some time, fights between greed and fear may ensue. Do we exit here or there? now or a few hours later? Will price move to a different direction if we let it go for a while, or will we be able to reap more profits that way? Therefore, applying a pre-planned exit strategy needs more mental strength and discipline than an entry strategy.
However, exit strategy, in reality, could be applied any way you would like. The thing to remember is just that exit strategy should be made by considering both the probability of profit and loss. In practical language, it means that if you have put on a Target Profit (TP), you should also put on a Stop Loss (SL) at a proportional level.
For example, a 50:50 ratio of SL and TP will put both your SL and TP at the same distance from your entry point; while a Fibonacci-based TP and SL would put SL and TP at the next Fibonacci level with varying distances from the entry-level. Or alternatively, you could take some shortcuts by applying trailing stop that could change SL and TP levels dynamically as the price moves.
You could also manually cut your trades by monitoring price movements. For instance, in the entry scenario with MA Crossover above, a trader will exit his trades when the indicator remains unchanged for a certain period. In such plan, TP is not needed, but traders should put in still a stop order to prevent unexpected interruptions from inflicting losses on your account balance.
Related Articles: