Dedicated FREE FOREX VPS
 Free FOREX Virtual Private Server
 MT4 Demo Contest, Get $500
 Sign Up for an Account, Claim 60% Deposit Bonus
 Free MT4/MT5 VPS 2024
 Send E-mail and Get Free Merchandise
 $1K Refer a Friend Bonus for Pepperstone Pro clients
 Maximize Your Earnings with 100% Deposit bonus
 Trade to Win, $5,000 Monthly Demo Contest
 Claim 30% + 15% Deposit Bonus from LiteFinance
The falling wedge pattern is especially known to form before a bullish breakout. With a good trading strategy, you could use this pattern to earn maximum gains.
Wedges are a form of technical chart pattern that is used for predicting trend reversals or continuations. In most cases when a market is trending, a wedge pattern will be formed on the chart. This wedge pattern can either be a rising wedge pattern or a falling wedge pattern, but this article will be focusing on the falling wedge pattern as well as how to build a trading strategy with it.
What is a Falling Wedge Pattern?
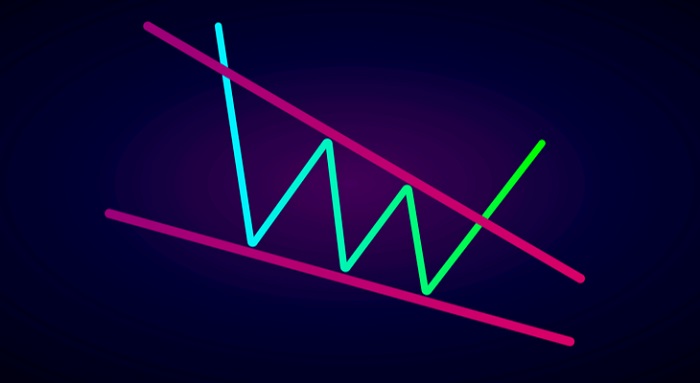
The falling wedge pattern is formed as a recognizable price move when a market consolidates between two converging lines of support and resistance. In such a case, the support and resistance lines must both point in a downwards direction with the resistance line being steeper than the support line. The falling wedge pattern is also known as the descending wedge pattern and it is an indication of future bullish momentum. The image below depicts a typical falling wedge pattern.
Identifying a Falling Wedge Pattern
A falling wedge pattern can either be a continuation or reversal pattern depending on the trend direction when the falling wedge is formed. It is a continuation pattern if it is seen in an uptrend while if it appears in a downtrend, then it is a reversal pattern. Below are the steps for identifying a falling wedge pattern:
- Pinpoint an uptrend or downtrend.
- Use a trend line to connect lower highs and lower lows as the two lines will slope downwards before converging.
- Identify divergence between the price and an oscillator such as the stochastic indicator or RSI (Relative Strength Index).
- Technical tools like oscillators can then be used to validate oversold signals.
- Find a break above resistance for a long entry.
Building the Trading Strategy
In building a strategy with the falling wedge pattern, there are 3 important things to consider:
- Opening a Position
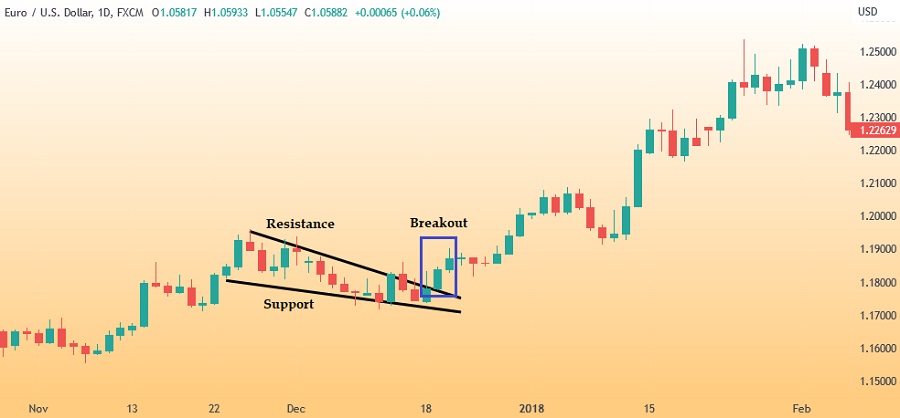
You have to bear in mind that not all falling wedges will result in a breakout which is why you must confirm the move before a position is opened. One way of confirming the move is to wait for the breakout to begin. Once it starts, you are looking for a substantial move that is beyond the resistance trendline.
Another way to confirm a wedge that is about to have a breakout is if you notice that the volume is falling as the market consolidates. A sudden increase in volume after a breakout is a good signal that a larger move is imminent.
- Taking Profit
For this aspect, the trader has to rely on two general rules about trading breakouts. The first rule is that previous levels of support are likely to become new resistance and vice versa. For instance, EUR/USD may hit 1.13, 1.14, or 1.15 as its peaks in a falling wedge. These points of resistance can then turn into levels of support in the next rising moves.
The second rule is that the previous channel's range can be an indication of the size of an ensuing move. This is determined by the gap between the high and low of the wedge from the start.
- Implementing Stop Loss
One benefit offered by trading breakouts is that it is usually clear when a potential move is no more valid. Let us assume that in the price chart of an asset, the price breaks out of the falling wedge upward before returning down again in a scenario known as "fakeout" or fake breakout.
The scenario of a fake breakout shows the importance of placing stop loss in the right place so that the trade can have sufficient wiggle room before it is potentially closed out. In this case, the stop loss should be placed below the lowest traded price in the wedge or even below the wedge itself.