 Dedicated FREE FOREX VPS
 Free FOREX Virtual Private Server
 MT4 Demo Contest, Get $500
 Sign Up for an Account, Claim 60% Deposit Bonus
 Free MT4/MT5 VPS 2024
 Send E-mail and Get Free Merchandise
 $1K Refer a Friend Bonus for Pepperstone Pro clients
 Maximize Your Earnings with 100% Deposit bonus
 Trade to Win, $5,000 Monthly Demo Contest
 Claim 30% + 15% Deposit Bonus from LiteFinance
Trading volume is a crucial aspect of crypto analysis. Candlestick, spot vs futures, support resistance, and price trend are some key aspects you need to utilize.
Crypto trading has become a popular investment option nowadays, and for some people, it can be a lucrative source of extra income. However, to be successful in crypto trading, one must have enough knowledge of market analysis and reading charts.
One popular way to analyze crypto price charts is by using trading volume. This indicator is believed to be able to analyze the current sentiment of the crypto market in real time. Hence, many crypto traders use trading volume before they decide to buy and hold or sell their assets.

What is Crypto Trading Volume?
Trading volume refers to the amount of crypto assets traded within a certain period. Volume analysis can provide a clear picture of the confidence behind market movements or liquidity at a particular level. By analyzing trading volume, traders can assess whether crypto price movements are supported by many buyers or sellers and whether there is an imbalance between the two.
For example, if Bitcoin is traded within a relatively small range but the volume is high, it indicates that buyers and sellers seem to agree that the current price is reasonable. Therefore, trading volume can be an important indicator in making crypto trading decisions.
How to Use Crypto Trading Volume?
After understanding a brief overview of trading volume, let's discuss how you can use it as an indicator in crypto trading. Here are some ways you can do it:
1. Using Volume per Candlestick
In crypto trading, using trading volume in technical analysis can help traders determine trends and the direction of asset price movements. One way to use trading volume is by looking at it per candlestick.
A candlestick is a type of chart that shows price movements within a certain period of time. Each candlestick has a body that shows the range between the opening and closing prices, as well as a shadow that shows the range between the highest and lowest prices during that period. In technical analysis, trading volume per candlestick can help traders obtain additional information about how prices move.
When the trading volume on a candlestick is high, it means many traders are trading during that period. If the candlestick has a green body (closing price higher than the opening price), then high volume can indicate a strong upward trend. Conversely, if the candlestick has a red body (closing price lower than the opening price) and high trading volume, this may indicate a strong downward trend.
When the price falls and trading volume is high, it may indicate that many people are selling their assets. Thus, it can be an indication of a strong downward trend. As a trader, you may consider selling your assets immediately if you anticipate the downward trend to continue.
However, as a crypto trader, it's important to remember that trading volume is just one indicator in market analysis. There are many other types of analyses that need to be considered, such as candlestick patterns and charts, as well as market sentiment. Using multiple analysis tools can help you make the best trading decisions.
2. Comparing Spot with Futures
The spot market is where traders can buy or sell crypto directly, just like on a crypto exchange. In the spot market, you can transact at the prevailing market price at that time. On the other hand, the futures market is where you can buy or sell crypto futures contracts. In the futures market, contracts are sold at a specific price and have a specific time frame in the future.
When analyzing trading volume, it's important to consider the difference between the spot market and the futures market. The spot market is considered more organic because its liquidity comes from actual market demand, while the futures market relies on market makers or artificial liquidity.
By comparing the trading volumes between them, it can provide insights into the direction of the market. If the trading volume of the spot market shows a strong upward trend while the trading volume of the futures market shows a downward trend, it may indicate uncertainty or disagreement in the market.
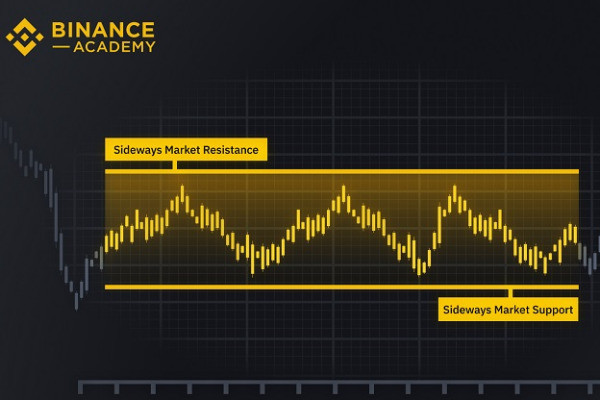
3. Observing Support and Resistance Levels on High Volume
Support and resistance levels are areas where prices tend to have difficulty breaking through or moving past the level. In crypto trading, traders often monitor support and resistance levels because they can provide clues about the direction of future price movements. However, observing support and resistance levels alone is not enough, you also need to pay attention to the trading volume that occurs when prices try to break through those levels.
High trading volume at support or resistance levels can indicate strong interest from market participants and signify the possibility of a change in the direction of price movements. However, this does not always mean that significant price movements will occur or that a reversal will occur.
Conversely, low trading volume at support or resistance levels does not always mean that prices will continue to move in the previous direction. However, in many cases, price movements will still follow the existing trend, even with low trading volume.
4. Observing Differences between Trends and Volume
When trading crypto, it is important to pay attention to the differences between trends and trading volume. Trends refer to the direction that prices take over a certain period of time, while trading volume refers to the amount of assets traded over a certain period of time.
When prices continue to rise on a lower volume, it can indicate that only a few people are contributing to that trend, which can mean that the trend is not sustainable in the long run. However, this does not always mean that the trend will reverse. Conversely, an uptrend with high trading volume indicates a lot of trader interest in that price but does not guarantee that the trend will continue in the long run.
To get more confirmation, traders must consider technical analysis, market sentiment, and other fundamental factors before making trading decisions.
Conclusion
In crypto trading, trading volume can be a very useful indicator in predicting future price movements. The high or low trading volume is directly proportional to the level of market interest in the asset. In addition, trading volume can also provide information about the liquidity of traded crypto assets. The higher the trading volume of an asset, the more liquid that asset is.
Although trading volume can be a useful indicator, it still cannot guarantee profits. Risks still exist in crypto trading. In addition to knowing the difference between trends and trading volume, you should also be able to use volume in various ways as outlined in the points above. This will allow you to make more informative and accurate trading decisions.
Apart from using trading volume, you can analyze cryptocurrency using various strategies. For example, there are 5 strategies that you can explore here.


 Bitcoin
 Ethereum
 Tether
 BNB
BNB Solana
 USDC
USDC XRP
XRP Dogecoin
 Toncoin
 Cardano