 Dedicated FREE FOREX VPS
 Free FOREX Virtual Private Server
 MT4 Demo Contest, Get $500
 Sign Up for an Account, Claim 60% Deposit Bonus
 Free MT4/MT5 VPS 2024
 Send E-mail and Get Free Merchandise
 $1K Refer a Friend Bonus for Pepperstone Pro clients
 Maximize Your Earnings with 100% Deposit bonus
 Trade to Win, $5,000 Monthly Demo Contest
 Claim 30% + 15% Deposit Bonus from LiteFinance
EMA is one of the most widely used technical indicators in forex trading thanks to its ability to easily identify the market trend. Find out the various types of EMA strategy for day trading in this article.

The Exponential Moving Average (EMA) is often utilized as the center of various trading strategies. It becomes a favorite because of its simple calculation, accessibility, and overall indication that traders can read from.
Meanwhile, Day trading is a form of trading conducted within a single trading day. Even though the price movement may be small, day trading can be highly profitable if done properly.
Day traders usually use technical indicators such as EMA to read the pattern of price movement on a 1-hour to 4-hour chart. Below are some examples of EMA strategies for day traders.
1. Floor Trader's Method
The Floor Trader's Method is a trend-following strategy that is often implemented in day trading with a 1-hour or 4-hour time frame. The concept of this strategy is as follows:
- During trending, retracement will always occur.
- Use 9 EMA and 18 EMA to identify trend direction, and place a trade based on the trend direction.
- Use candlestick reversal patterns such as bullish/bearish engulfing or doji as the signal for entry after retracement occurs.
The chart below is an example of a sell setup in a downtrend.
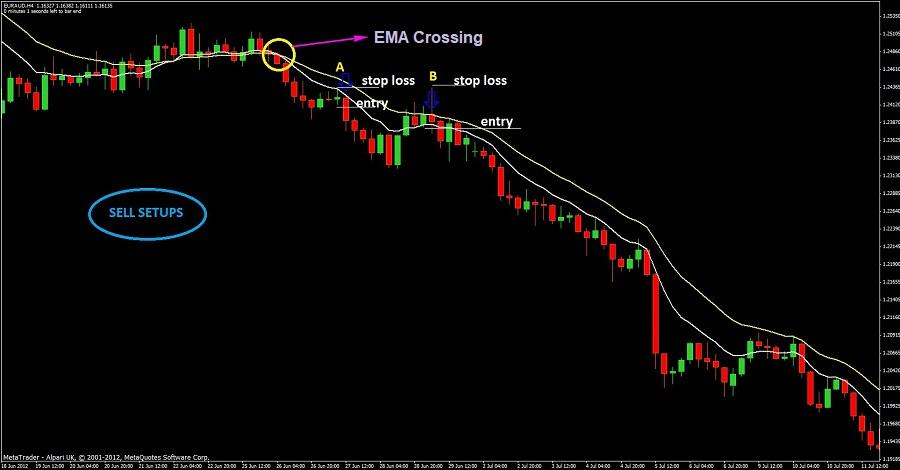
- Wait until the 9 EMA crosses the 18 EMA to the downside, which signals a downtrend.
- Wait for a retracement where the price moves up and touches the 9 EMA or both the EMAs.
- Observe for candlestick reversal pattern, and short the currency when pullback occurs and the price breaks the previous bar's low.
- Place the stop loss 1-5 pips above the high from the previous retracement.
The chart below is an example of a buy setup in an uptrend.
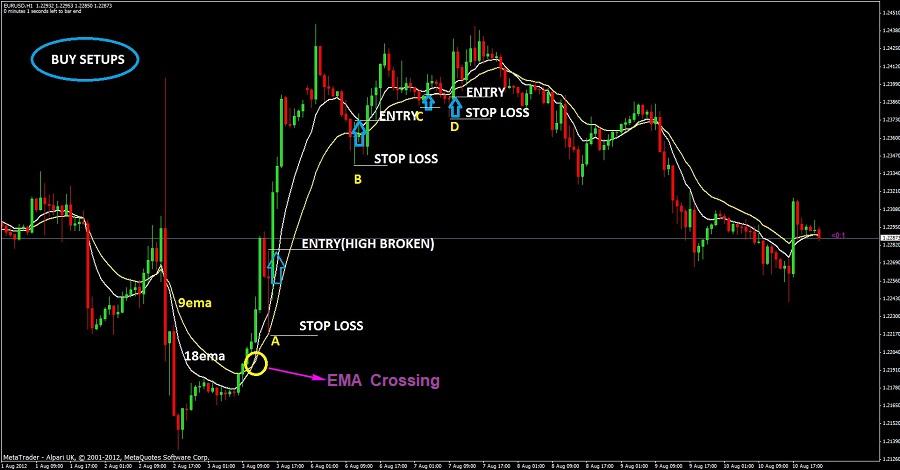
- Wait until the 9 EMA crosses the 18 EMA to the upside, which signals an uptrend.
- Wait for a retracement where the price moves down and touches the 9 EMA or both the EMAs.
- Observe for candlestick reversal pattern, and long the currency when pullback occurs and the price breaks the previous bar's high.
- Place the stop loss 1-5 pips below the low of the previous retracement.
The exit level can be determined through various ways, such as by moving the stop loss to break even, using a trailing stop, setting the risk/reward ratio at 1:2 or 1:3, using Fibonacci retracement or expansion levels, or by identifying the closest support and resistance level.
Pros and Cons
The advantage of this strategy is that it is easy to implement. The probability of success is quite high provided that traders enter at the right time, which is at the first retracement after the EMA crossover. In addition, trading in a higher time frame will generate better accuracy.
However, this strategy may give false signals in a sideways market where the trend is weak. Also, if the trend is too strong, the retracement may not touch the EMAs, and traders will miss out on the perfect entry level even though the price has moved towards the trend direction. Moreover, the further the retracement is from the EMA crossover, the less accurate the signal is. From the chart above, A is more accurate than B, and B is more accurate than C.
2. 200 EMA Strategy for Day Trading
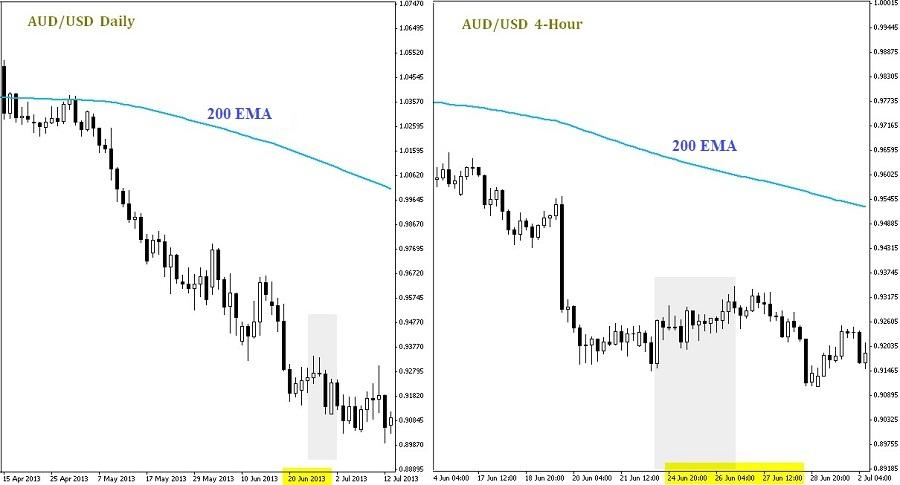
The 200 EMA is a popular indicator in forex trading. Identifying trends with 200 EMA is very simple: when the price is below the 200 EMA, it can be assumed that the direction of price movement is in a downtrend, and when the price is above the 200 EMA, it can be said that uptrend is in place. This strategy uses a daily chart, a 4-hourly chart to determine the trend direction, and an hourly chart to open a trade. Here is the concept of this strategy:
- Identify the trend direction on the daily chart by observing the price movement in regard to the 200 EMA. The trend on the daily chart is the major trend.
- Confirm the major trend by using the 4-hourly chart.
- Observe the trend direction on the hourly chart. If the trend is in the same direction as the major trend and the 4-hourly chart trend, we can open a position with "buy the dip or sell the rally" method, where we buy when the price pulls back or sell when it bounces.
Let's take a look at the two AUD/USD charts below. The daily chart and the 4-hourly chart showed that the AUD/USD was in a downtrend as the price was below the 200 EMA.
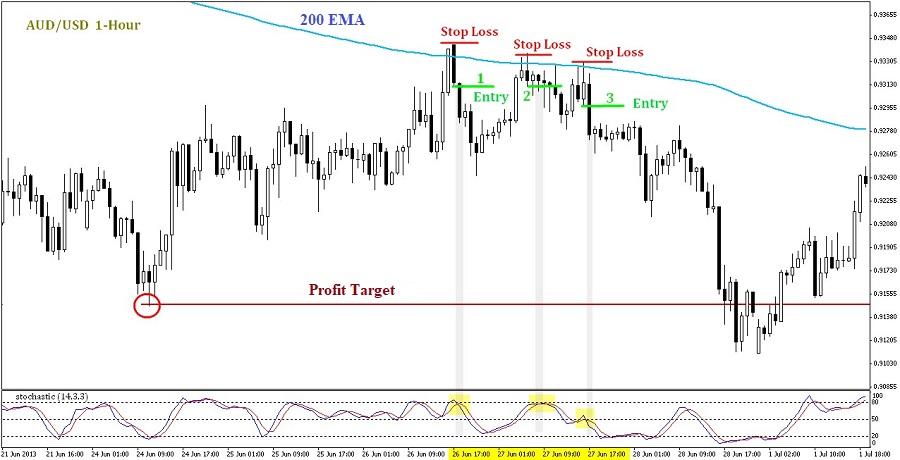
On the hourly chart below, the price also moved under the 200 EMA, signaling a downtrend. Now we wait for an opportunity to open a position. We look to place a sell order when the price bounces (moves in opposite direction) after crossing the 200 EMA.
As the confirmator, we can use the stochastic indicator. Short when the %K crosses the %D to the downside. Stop loss can be placed at the previous high before the price bounces, and the profit target can be placed at the swing low or around the immediate support.
If the trend direction on the hourly chart is different from that of the daily chart and the 4-hourly chart, wait until the trend is in the same direction. However, if the trend direction on the hourly chart is the same as the 4-hourly chart, but is different from the daily chart, it is better to not trade on that currency pair. It may take days for the three charts to have the same trend direction; a situation that isn't suitable for day traders.
3. EMA and LWMA Strategy for Day Trading
Instead of using EMA as the sole indicator, this day trading strategy also utilizes another type of Moving Average indicator, particularly the Linear Weighted Moving Average (LWMA). The setups are as follow:
- EMA of 38 and 48 periods.
- LWMA of 5 and 8 periods.
- Applied on an hourly chart (H1).
If the LMWA lines cross below the EMAs, it indicates a signal to initiate a short position. Conversely, if the LWMAs cross above the Exponential ones, you may consider opening a long position.
It's highly recommended to confirm the signal by the candlestick following the crossover. For a short position, the candlestick should close below the crossover, while for a long position signal, it should close above the crossover.
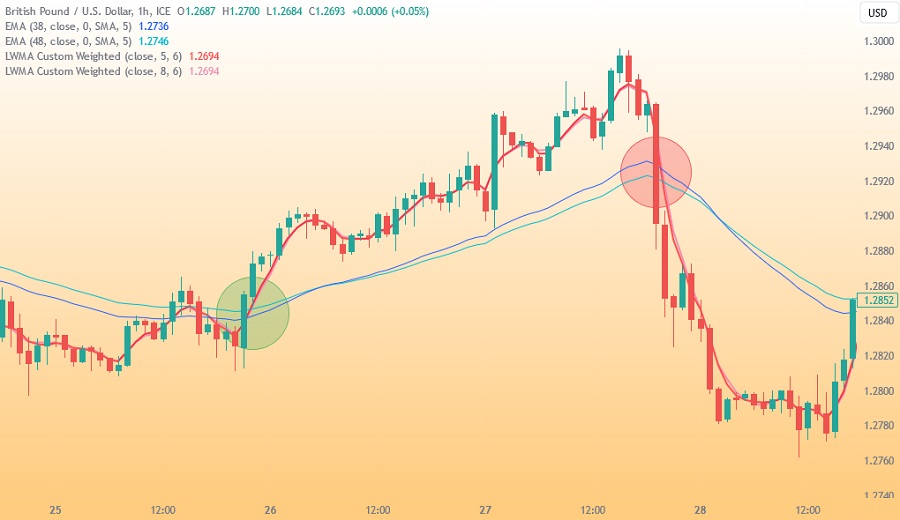
The chart above shows a good long opportunity (green circle) when the LWMAs (red lines) cross above the EMAs (blue lines). On the other hand, a scenario to open a short position is indicated in the red circle where LWMAs cross below EMAs.
Key Aspects to Use EMA for Day Trading
Apart from the strategies above, you can basically use any EMA period with any indicator combo for day trading as long as the time frame is right. If you're interested in building your own EMA setup for day trading, you need to master these 2 principles:
Most Common Periods in EMA
The number of periods that you choose for the EMA depends on your trading objective. If you want to trade in a short time, fewer-period EMAs are more suitable for you. Likewise, if you are prepared for long-time investment, a longer-term EMA is what you need. Below are four EMAs' periods commonly used by forex traders.
- Short-term EMAs (10 EMA, 20 EMA)
Traders tend to opt for short-term EMAs to trade with current market momentum as these EMAs are more responsive to price movement. The most commonly used short-term EMAs are the 10 EMA and 20 EMA. - Medium-term EMAs (50 EMA, 100 EMA)
The medium-term EMAs react slower than the short-term ones since there are more periods used for calculation. That's why these EMAs are more suitable to read medium-term movements. The 50 EMA is widely used by traders for medium-term trading. It is considered one of the most effective trend indicators while also offering dynamic support and resistance levels on charts. - Long-term EMAs (200 EMA, 365 EMA)
The long-term EMAs are utilized by traders who engage in long-term trading. The 200 EMA is the choice of many traders on daily charts. It is said that institutions like banks, hedge funds, and forex dealers make use of this indicator. - Fibonacci EMAs (5, 8, 13, 21, 34, 55, 89, 144 EMAs)
Some traders prefer to use the Fibonacci sequence for EMA calculation. The most common Fibonacci-based EMAs are the 5 EMA, 8 EMA, 21 EMA, 55 EMA, and 144 EMA.
Traders must always be aware of the fact that EMA is a lagging indicator. It is based on past information, thus providinged feedback. A 100 EMA will have a greater lag than a 10 EMA because it calculates the prices from the past 100 periods.
On the other hand, the short-term EMAs react quicker to the change in price movements, thus ideal for day trading strategies.
Various Purposes of EMA
The EMA can be used in many ways. However, there are three basic uses of EMA in forex trading:
- To Identify and Confirm the Market Trend
A market is considered to be an uptrend if the price is above the EMA and the EMA line is positive, meaning that it moves upward. A market is considered to be a downtrend if the price is below the EMA and the EMA line is negative, meaning that it moves downward. When the EMA line is flat, the market is in range and there is no major trend taking place. Avoid opening a trade if you encounter this market condition. - To Indicate Dynamic Support and Resistance Levels
Exponential Moving Averages provide traders with the ability to place dynamic support and resistance levels because EMAs are constantly changing as dictated by recent price movements. Traders commonly use 200 EMA for the long term, 50 EMA for the medium term, and 21 EMA. - The Crossover
The premise of trading with EMA crossover is pretty simple. We use two EMAs (one with a shorter period and one with the longer period) and track the signal when a crossover takes place. An EMA crossover works best when the market is trending. When the market is in range, however, the crossover is prone to whipsaws and we should avoid opening a trade.
Unlike dealing with EMA periods, you can choose whichever EMA use in your day trading strategy. You can make use of EMA as a trend identifier or confirmator, as dynamic support and resistance, or take the crossover signals for day trading. Once again, the key is you use the right time frame and short-period EMA.


2 Comments
Adelle
Jan 12 2024
Hi there! I've got a question about the values associated with EMA. In the article, it mentions that traders often go for short-term EMAs, like the 10 EMA and 20 EMA, to align with current market momentum because these EMAs are quick to respond to price changes. The article suggests that for long-term trading, the numbers for EMA can go even higher. I'm curious about the significance behind these EMA numbers. Additionally, are there any distinctions in the numbers used for EMA compared to those in Moving Averages?
Joyce
Jan 15 2024
The importance of these EMA figures lies in their ability to promptly respond to changes in prices. Short-term EMAs, with smaller values like 10 or 20, are adept at capturing rapid fluctuations, making them well-suited for traders aiming to keep abreast of the current market dynamics. Conversely, when it comes to long-term trading, larger EMA values offer a more comprehensive outlook, smoothing out market noise and accentuating prolonged trends. These numerical values also signify the duration of data considered by Moving Averages (MA) or Exponential Moving Averages (EMA) – for instance, 10 corresponds to a 10-day period, and 200 denotes a 200-day period.
Regarding disparities with the numbers used in other types of Moving Averages, there isn't much distinction. Since EMA is a subtype of Moving Average, discussions about EMA numbers essentially pertain to the values utilized in the Moving Average computation. Whether dealing with EMA or different varieties of Moving Averages, the numerical values indicate the timeframe over which the average is computed – shorter for capturing immediate trends and longer for a more extensive perspective. I hope that clarifies things!