 Dedicated FREE FOREX VPS
 Free FOREX Virtual Private Server
 MT4 Demo Contest, Get $500
 Sign Up for an Account, Claim 60% Deposit Bonus
 Free MT4/MT5 VPS 2024
 Send E-mail and Get Free Merchandise
 $1K Refer a Friend Bonus for Pepperstone Pro clients
 Maximize Your Earnings with 100% Deposit bonus
 Trade to Win, $5,000 Monthly Demo Contest
 Claim 30% + 15% Deposit Bonus from LiteFinance
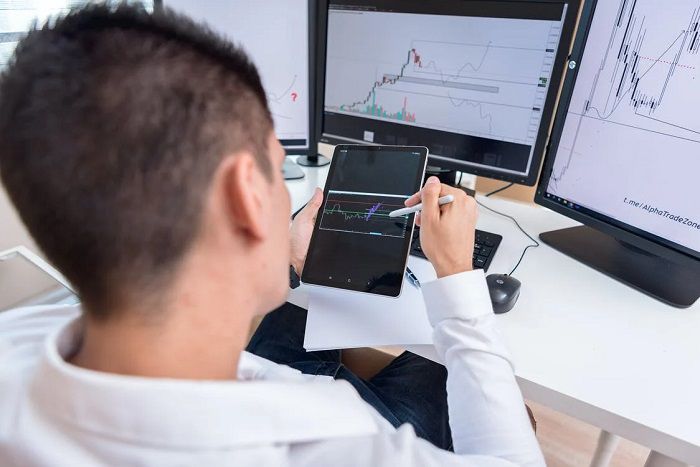
Many beginners are known to rely heavily on trading indicators to look for trading opportunities. But what about professional traders? Do they use indicators too?
As a beginner trader, it is easy to become obsessed with technical indicators. They are easy to use, highly accessible, and relatively inexpensive. Some traders even spend years trying to find the perfect indicator or a combination that could bring them enormous fortunes. However, does the same thing apply to professional traders too?
As you may already know, professional traders typically have a unique approach when it comes to executing their trades, and that might be the secret behind their success. The truth is, not all professional traders use indicators. Those who rely on technical analysis certainly incorporate indicators in their strategies. Others who do not, however, tend to keep the use of indicators to a minimum and some even don't use indicators at all. That being said, let's dive into the minds of professional traders and figure out their preferences in using technical indicators.
Contents
Types of Trading Indicators
To begin with, it is important to understand that technical indicators serve various functions and they can be categorized into several major groups. Usually, traders would choose indicators with different functionalities that complement each other in order to perform optimally.
The first category is based on the indicator's ability to predict the price or determine the signal after the price action. There are two indicators in this category, namely:
- Leading Indicators: A type of indicator that is able to provide a trading signal before a movement in the market happens. Therefore, leading indicators are often used to identify potential price reversals or early trends. Leading indicators are often seen as superior due to their predictive power, but it's worth mentioning that they're prone to false signals as they are anticipating the price direction ahead of time. Some examples of leading indicators are the Relative Index Strength (RSI), Stochastic oscillator, and Parabolic SAR.
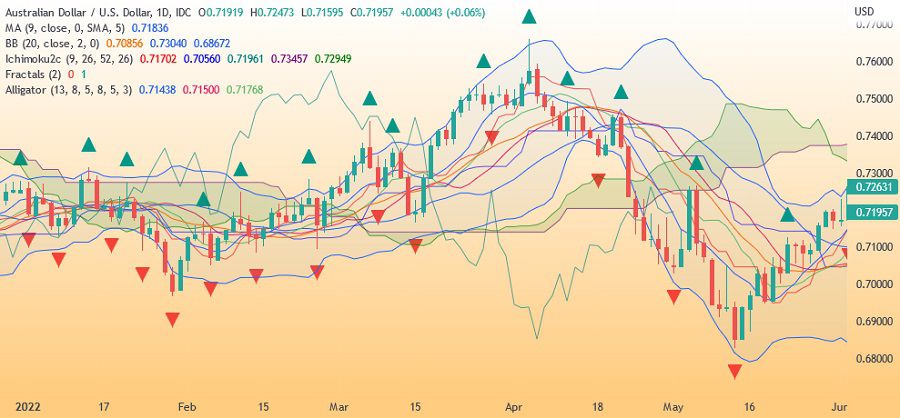
- Lagging Indicators: A type of indicator that follows the price, so it can only provide a signal after the price movement occurred on the chart. This is why they are usually applied to see the strength of the current trend or to confirm trading signals from other indicators. Some of the common examples of lagging indicators are Bollinger Bands, Moving Averages, and Moving Average Convergence Divergence (MACD).
Moreover, technical indicators can also be divided into four categories based on the aspects that they focus on:
- Volume Indicators: As the name implies, this type of indicator measures the level of appetite toward a particular asset through the buying and selling activity, so they can be helpful to analyze the market sentiment and confirm the change or continuation of the trend's direction. Two of the most popular volume indicators are On Balance Volume (OBV) and the Klinger Indicator.
- Trend Indicators: This type of indicator can help traders determine the current and potential direction of the trend. For instance, you can use the indicator to identify whether the market is currently trending or ranging. The easiest example of trend indicators is Moving Averages.
- Momentum Indicators: This type of indicator can provide information about the trend strength as well as the speed at which the price is moving in a given direction. As such, you can determine potential reversals when the trend's strength is weakening and help you spot overbought and oversold conditions. Also, note that many momentum indicators are oscillators, which basically consist of a trend indicator that fluctuates between an upper and lower limit. The Relative Strength Index (RSI) is a common example of this indicator type.
- Volatility Indicators: This type measures the volatility of an asset, which is the rate of the price changes over a certain period. Volatility is an important aspect in every market because it can tell you the right time to take advantage of the market. Usually, trading opportunities occur during high volatility as it can easily form a strong trend. In contrast, a lack of volatility indicates a low chance of making returns because the price doesn't change much. One of the classic examples of volatility indicators is the Bollinger Bands.
Potential Downsides of Technical Indicators
Technical indicators may provide useful information here and there, but they actually have several disadvantages that can make you lose money instead. Here are two possible reasons why technical indicators can be bad for your trades:
Too Much Information
We've mentioned that there are loads of indicators out there and it's very easy to get attached to them due to the various functionalities. As a result, many traders might just dump a bunch of indicators on the chart in hope to get a complete analysis of the current market condition. Unfortunately, putting a bunch of indicators on top of each other will not improve your analysis in any way. In fact, it will only make it worse.
If you use too many indicators without thinking about the function of each one, you may end up with a crowded and oversaturated chart. There will be a lot of unnecessary information going on and perhaps even redundant signals if you use several indicators of the same type.
When it's time to finally make a move, you might find it hard to interpret the chart accurately due to the overloaded data. In other words, the indicator might be showing the right signal at the right time, but it becomes useless because you may be focusing on a bunch of different things at the same time.
It Can Be Distracting
Another reason why you shouldn't put too many indicators on the same chart is that it can be really distracting at times. As explained above, the presence of indicators can make traders lose focus due to the overwhelming amount of data. As a result, the trader would spend more time staring at the screen and filtering the information from the indicators instead of building the strategy. The worst scenario is that they choose to focus on the wrong signal and make an unwise decision based on that, which then could lead them to losses.
How Professional Traders Use Indicators
It is important to understand that not all professional traders are the same, so surely there are lots of mixed opinions and different trading strategies that they use personally. This explains why some professional traders prefer to use indicators, while some others tend to avoid using indicators at all costs. But to make things easier, we can categorize them into two broad categories, namely professional retail and institutional traders.
Retail Traders
A retail trader is an individual trader who trades with their own money. Typically, retail traders are the ones who rely on trading indicators the most because they use technical analysis as the fundamental part of their trading strategy. However, they can be categorized into smaller groups based on the trading style they use. This is also related to their level of dependence on technical indicators.
- Intraday Traders and Scalpers
Intraday traders and scalpers prefer to trade in shorter time frames. Therefore, they need to use technical indicators in order to set up their entry and exit points. Since they make use of short-term price movements that occur in a single trading day, they need to make sure that they catch the right signals and make profitable quick decisions. - Multiple Time Frame Traders
Multiple time frame trading refers to a trading method that uses one asset across different time frames. Using multiple time frames at the same time allows traders to hedge their positions by opening a new position with the same asset in a different time frame. However, it's worth noting that even though they use the same asset, the support and resistance levels for each time frame might not be the same. They need to use at least one indicator to maximize their potential profit. - Trend Traders
When it comes to trend trading, momentum is a crucial aspect that simply cannot be ignored. To be more precise, momentum is used by long-short traders to determine their entry and exit points on the chart. Therefore, they need to use momentum indicators to find the best trading opportunity.
Institutional Traders
Unlike retail traders, institutional traders don't trade with their own money. Instead, they use the money owned by the institution that they manage. Due to the size of their capital, they can make much larger trades. Thus, they usually approach the market differently in order to make significant profits. They also have access to various trading instruments that are not necessarily available for retail traders, such as IPOs, swaps, and forward contracts.
Typically, institutional traders would execute their trades in several phases due to their large transaction size. They tend to trade in the long term so they usually focus more on fundamental analysis instead of technical analysis. This means, they are less reliant on technical indicators and some of them may even avoid using indicators entirely.
Conclusion
Technical indicators can indeed help traders to make profits, but they are certainly not the holy grail that everyone is dreaming about. The truth is, they simply indicate what has happened, not what will happen. Thus, you shouldn't fully rely on them to make predictions of future price movements. The fact that many professional traders can make money without using a lot of indicators shows that it takes a lot more to be successful than just a good indicator. What's more important is your understanding of the market and how you see the bigger picture.
To actually improve your trade, you can try several trading indicators with specific purposes that could provide the data you need to make a profitable analysis. Remember not to make the mistake of putting unnecessary indicators on the chart or copying other traders' settings without understanding the strategy behind it.
One of the more well-known problems of using technical indicators is repainting. What is it and how to deal with repainting indicators?


2 Comments
Gertindale
Jun 10 2022
Why shouldn’t I copy other traders' strategy?
Divany
Jun 30 2022
Gertindale: Blindly copying other trader's strategy without knowing the thought process behind it might not give you the result you wanted because you only see the surface, not the complete picture.
Remember that every trader has a personal goal, trading style, and capability. Thus, you need to find a trading strategy and indicators that work for you. It's okay to look up to successful traders and observe how they work, but don't just follow them completely without considering the impact on your trade.