 Dedicated FREE FOREX VPS
 Free FOREX Virtual Private Server
 MT4 Demo Contest, Get $500
 Sign Up for an Account, Claim 60% Deposit Bonus
 Free MT4/MT5 VPS 2024
 Send E-mail and Get Free Merchandise
 $1K Refer a Friend Bonus for Pepperstone Pro clients
 Maximize Your Earnings with 100% Deposit bonus
 Trade to Win, $5,000 Monthly Demo Contest
 Claim 30% + 15% Deposit Bonus from LiteFinance
A triple screen trading strategy uses three screens for monitoring the price movement with three different time frames to get a higher chance of getting accurate trading signal.
A triple screen trading strategy or the three-screen system is developed by Dr. Alexander Elder, a trader who is also known as a psychiatrist. The detail of the trading strategy is described in his best-seller book, "Trading for a Living". This strategy uses 3 screens for monitoring the price movement, and each of them shows a different time frame.
Most traders normally use a single screen to monitor price charts and their trades. Using a single frame is enough to make the decision, but the use of more than one screen can be useful to avoid the conflict among indicators. It usually happens among trend indicators (such as Moving Averages or ADX) and the oscillators (like RSI or Stochastic).
Let's say you use both types of indicators. At the uptrend market, the trend indicator shows a signal to buy. However, the oscillator indicator shows that the price is overbought so a sell entry should be in order.
Conversely, for the downtrend market, a sell signal from the trend indicator can happen at the same time with an oversold condition signaled by an oscillator. This kind of conflict does happen and often leads to misinterpretations in the decision-making process of opening a trade.
The extremely complicated and unpredictable market conditions are what causes the conflict between different types of indicators. If the trend is strong, signals from the trend indicator would follow the direction of the trend.
However, if the market condition changes into the sideways (ranging) condition, the trend indicator might be difficult to read and this is usually when the oscillator would be more accurate.
Yet, it is hard to know certainly when the market condition will change. Many traders add other indicators as a means of confirmation, but it doesn't guarantee accuracy. To overcome this weakness, a triple screen trading strategy could help you.
Contents
The Time Frame Setups
Did you know? A trend indicator can show different signals if it is used in different time frames. For instance, a trend indicator can show a buy signal in a daily chart, but the signal in the weekly chart can favor a short position.
The thing is, the smaller the time frame is, the more extreme the price movement is. Therefore, signals in small time frames are usually very temporary and can't be regarded as the general outlook for the price movement.
As a solution, Dr. Elder divides the time frame with factors 5 to 6. The monthly time frame becomes 4.5 weeks (weekly), the weekly time frame becomes 5-day (1 week, 5-day active market), and the daily time frame becomes 5 to 6-hour. For daily traders, the hourly time frame becomes a 10-minute frame (the division factor = 6), and the 10-minute time frame becomes a 2-minute frame (the division factor = 5).
The strategy to open and close the trades is based on the smallest time frame. So if you want to decide in a weekly time frame (in this case 4.5-week time frame), you must monitor the monthly time frame. If you use a 10-minute time frame, you must also consider the hourly time frame.
In a triple screen trading strategy, the main time frame is called the intermediate time frame, the higher time frame is named the long-term time frame, and the lower time frame is defined as the short-term time frame. The trend is determined by the long-term time frame, and the signal to enter the market happens if the signal in the intermediate time frame trend is opposite to the long-term time frame.
For example, if a bullish weekly trend happens, it means the signal for buying It is because the price movement at the 5-day time frame tends to head lower.
The Market Trends
According to the analysts that observe the price market throughout history data, there are generally three types of market trends, the long-term trend in the years' interval, the middle-term trend in months interval, and a short-term trend in a less-than-a-month interval. Robert Rhea, a technical analyst, mentions those three trends as "tides" for the long-term, "waves" for the middle-term, and "ripples" for the short-term.
In the last century, trading by following the long-term tides was considered one of the best strategies. If a trader wanted to enter and exit the market, he ought to follow the middle-term waves, while the short term ripples were rarely noticed.
However, with the increasing amount of traders in the world today, the market has become more complicated. Nowadays, many traders are also following the middle and short-term using different time frames.
If you plan to hold a trading position for a few days or weeks, you should concentrate on the daily chart as your intermediate time frame. The long-term time frame is weekly and the short-term time frame is hourly.
But if you are likely to hold positions for a maximum duration of an hour, concentrate on a 10-minute time frame with an hourly chart as the long-term time frame and a 2-minute chart as the short-term time frame.
The First Screen: Identifying the Market Tides
The long-term tides are fundamental in making the trading decision. First, you should analyze the long-term time frame, which is a level above the intermediate time frame. The long-term time frame is the first screen from the triple-screen system. If your main time frame is a daily chart, you must get the 5-day time frame and start to analyze the weekly time frame too.
By using Robert Rhea's term, if the long-term trend is on the high tide, then the weekly trend is bullish. Consequently, the moment to enter the market is when the trend wave is on the intermediate time frame (5-day) goes lower. On the other hand, when the long-term trend is on the low tide or bearish, it means the moment to go short is when the price in the intermediate time frame heads higher.
The Second Screen: Analyzing the Market Waves
Traders normally concentrate on the daily chart with only one indicator that is based on the trend direction from the weekly time frame (long term time frame). For example, when the weekly time frame trend increases, the traders only focus on the buy signal on the daily chart without accounting the probability of the sell signal.
The price movement on the intermediate time frame is not observed through a trend indicator such, but with an oscillator. The basic characteristics of the oscillator indicator are showing the buy signal when the price market falls to a certain extent (oversold area) and the sell signal when the price market rises to a certain degree (overbought area).
Those signals are shown like waves that show the entry moments. Four oscillator indicators are usually applied in this trading strategy are as follows:
1. Force Index
The indicator is devised by Dr. Elder for measuring the bullish and bearish power in using the Moving Average. For the triple screen trading strategy, the parameter for the Exponential Moving Average (EMA) is set in 2-period (EMA-2). In Dr. Elder's opinion, EMA-2 in Force Index Indicator is very suitable to be combined with trend indicators such as MACD.
In the MetaTrader platform, this indicator can be found in Insert Menu -> Indicators -> Oscillators -> Force Index. The following chart shows how the Force Index Indicator is applied in the EUR/USD daily chart:
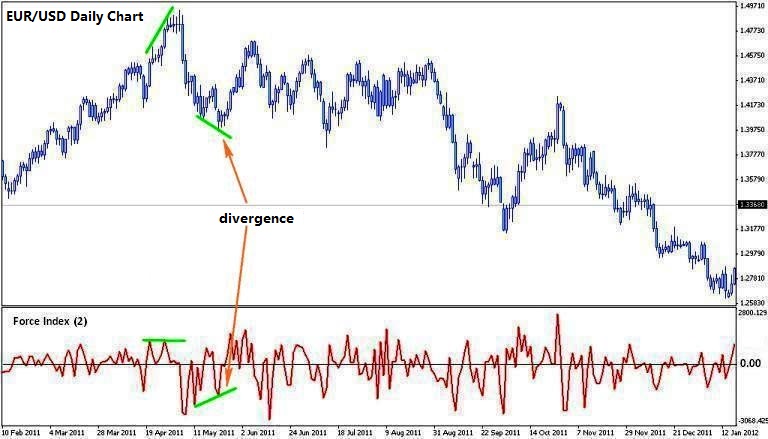
If the EMA-2 line in the Force Index Indicator is above the 0.0 level, it means the bullish sentiment is stronger. But if it is under the 0.0 level, the bearish sentiment is stronger.
If the indicator is used for the main time frame of the triple screen system (5-day time frame), and the MACD histogram at the weekly time frame forms a slope to the top or bullish, you can plan to open a buy position when the Force Index is in a negative area with an upside pullback momentum.
The buy position should be opened above the highest level on that day. In this case, you can use a stop order (buy stop) to wait for confirmation. The stop loss can be placed on the lowest level that day or the day before, depends on which one holds the lower price.
If the trend direction is confirmed, your buy order will be executed. However, if the signal is not confirmed and the price does not trigger the buy stop order, your position will not be executed.
The exit level can be set manually when the trend in the long term time frame (weekly) has moved in the opposite direction. Also, it can be set manually when a bearish divergence happens in the main time frame (daily). The signal shows that the upcoming trend is changing from bullish to bearish.
2. Elder Ray Index
The second type of oscillator used on the second screen is Elder Ray. The indicator is designed by Dr. Elder based on the bullish and bearish power in the market. The bullish power measures the market's ability to push the price above the average range at the moment, while the bearish power measures the market's ability in pushing the lower price from the average range.
By using a trend indicator such as MACD in the long-term time frame, you can identify the trend direction in the long term. The Elder Ray indicator is used for deciding the entry moment.
If the price movement at the weekly time frame is bullish or forms an uptrend, you should concentrate at the buy signal in the 5-day time frame (based on the rules of triple screen trading strategy). Otherwise, you may wait for a sell signal in the main time frame if the trend in the long-term time frame is bearish.
The Elder Ray indicator can be inserted in a MetaTrader chart from Insert menu -> Indicators -> Oscillators -> Bulls Power and Bears Power. The default used is 13. Here is the example of Elder Ray indicator applied on a EUR/USD daily chart:
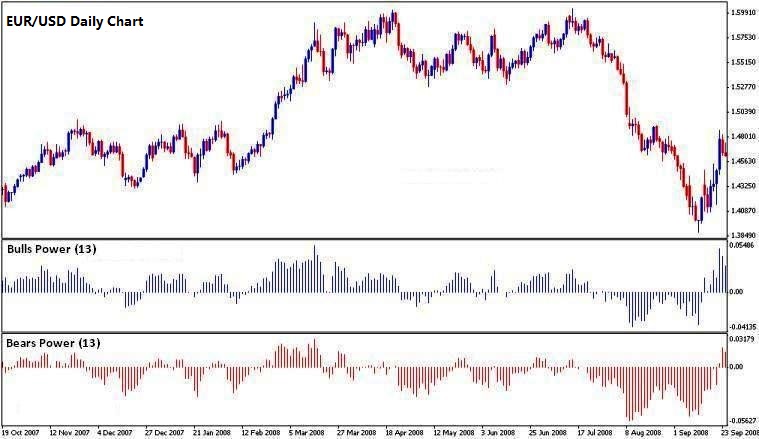
The ideal moment to buy is when the price movement in a long-term time frame is bullish, and the Bears Power is in the negative area (under the 0.0 level) but the direction begins to move up. If the weekly time frame is bullish, you should pay attention to the Elder Ray's signal in the intermediate time frame (5-day).
Other important things concerning Elder Ray oscillator:
- Avoid opening a buy position when the Bears Power in the positive area or above the 0.0 line.
- The exit level is set manually when the Bears Power is in the positive area and getting stronger, and the Bulls Power is in the negative area or the weak positive area.
- For a sell signal, make an entry when the weekly time frame (bearish) and Bulls Power is in the negative area, but it moves up to the top.
The entry signal is more accurate when there is a divergence between Bulls Power or Bears Power with the price movement. The bullish divergence happens when the Bears Power forms higher lows but the price is failed to reflect similar conditions.
Conversely, the bearish divergence happens when the Bulls Power forms the lower lows but the price's lows move higher instead.
3. Stochastic
Other than Force Index and Elder Ray, Stochastic also serves as in ideal oscillator for the triple screen trading strategy. The indicator is quite popular among forex traders and considered to be good enough to filter noises or useless signals.
Three ways in using Stochastic are by observing the divergence, identifying the overbought and oversold levels, as well as using the Stochastic lines crossing. The default parameter for the setup is 9, 3, 3, or 14, 3, 3.
These are two examples of Stochastic implementations (9, 3, 3) on the second screen (intermediate time frame) for a 5-day EUR/USD chart:
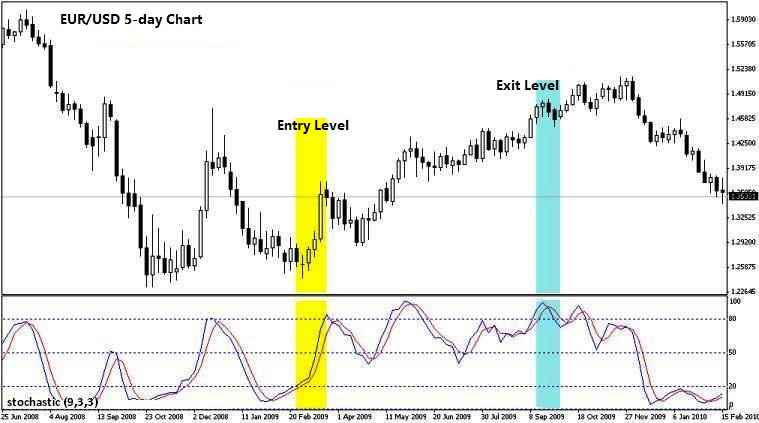 Trading with Stochastic lines crossing
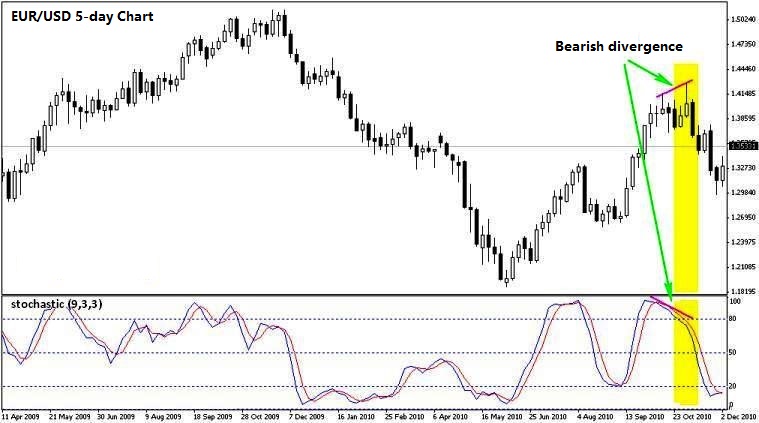 Trading with Stochastic divergence
4. Williams Percent Range
Williams Percent Range is often written as Williams%R or just %R. The indicator is invented by Larry Williams, a commodity trader who also deals in the forex and stock market. Williams%R was published in 1973 and is included as an oscillator because of its signal value that fluctuates between a range of 0 to -100.
Williams %R is often compared to Stochastic because of their similarities. If the Stochastic's value ranges from 0 to +100, the %R's is 0 to -100. However, the %R does not use the smoothing factor like Stochastic.
The Williams %R shows the relation between the closing price and the price range (the highest price to the lowest price ) in some interval. The popular main feature of this indicator is the ability to predict price trend reversals.
The Third Screen: Placing the Orders
The third screen is the short-term time frame. Based on the standard of triple screen trading strategy, the third screen is used for placing the trading positions, either buy or sell orders, depending on the analysis on the first and the second screen.
The order type used in this strategy is Stop Orders, with the buy stop order applied when the market is in an uptrend, while the sell stop order is relevant to a bearish market.
For example, if the weekly time frame is bullish and the oscillator in the 5-day time frame (the second screen) is rising, we can place the buy stop order on the third screen to anticipate a breakout on the upside. On the other hand, if the weekly time frame is in bearish condition (downtrend) and the price movement in the second screen (5-day) climbs up, we should order a sell stop on the third screen to anticipate a breakout on the downside.
Planning a trading strategy is a thorough process that needs to be implemented first in a practice account. The purpose is to avoid any real risk that comes with the live account. Therefore, using the forex demo account as a training field is no less important than the strategy planning.


3 Comments
Jarell
Sep 18 2021
What do you mean by a 5-day chart?
I'm confused by that. wouldn't that be a weekly chart?
Rachel
Jan 14 2024
Hello! I'd like to inquire about something. The article mentions that many traders typically employ a single screen for monitoring price charts and trades. While a single screen suffices for decision-making, employing multiple screens can be beneficial in preventing conflicts among indicators. I'm curious to know what type and size of monitors are required for implementing the triple screen strategy. Specifically, is a very large monitor necessary, or would a standard computer monitor suffice? Additionally, are there any advantages to using a larger monitor as opposed to a smaller one? Thank you.
Gianluigi
Jan 17 2024
Hey! Alright, let's dive into the triple screen strategy and what kind of monitor setup you might need. So, you don't have to go all out and get a ginormous monitor for this. A regular computer screen is usually good enough. The key is having enough space to juggle multiple charts and indicators without feeling like you're playing a game of Tetris with your trading setup.
Now, having a bigger monitor can be pretty sweet. It gives you more room to spread out and see things clearly. Imagine having a widescreen view of all your charts and indicators without squinting or constantly scrolling. It's like going from a small TV to a big, fancy home theater experience. However, let me throw in a reality check – it's not a deal-breaker. Whether you go for a big screen or stick with a regular one really depends on your personal vibe. But for me, I think bigger monitor is better!