 Dedicated FREE FOREX VPS
 Free FOREX Virtual Private Server
 MT4 Demo Contest, Get $500
 Sign Up for an Account, Claim 60% Deposit Bonus
 Free MT4/MT5 VPS 2024
 Send E-mail and Get Free Merchandise
 $1K Refer a Friend Bonus for Pepperstone Pro clients
 Maximize Your Earnings with 100% Deposit bonus
 Trade to Win, $5,000 Monthly Demo Contest
 Claim 30% + 15% Deposit Bonus from LiteFinance
Trend reversal is one of promising signal that given by chart. Price action traders usually take the benefit from this condition to maximize their profit. How to make it useful?
I know that there are already so many price patterns traders use to get a trading signal. But, not many of them work as advertised. So, let's find one that is the best price pattern, here!
The Best Price Pattern is Only as Good as You are
The secret to the best price pattern is rather simple; you.
Best price pattern only works when you understand how it should perform in specific situations
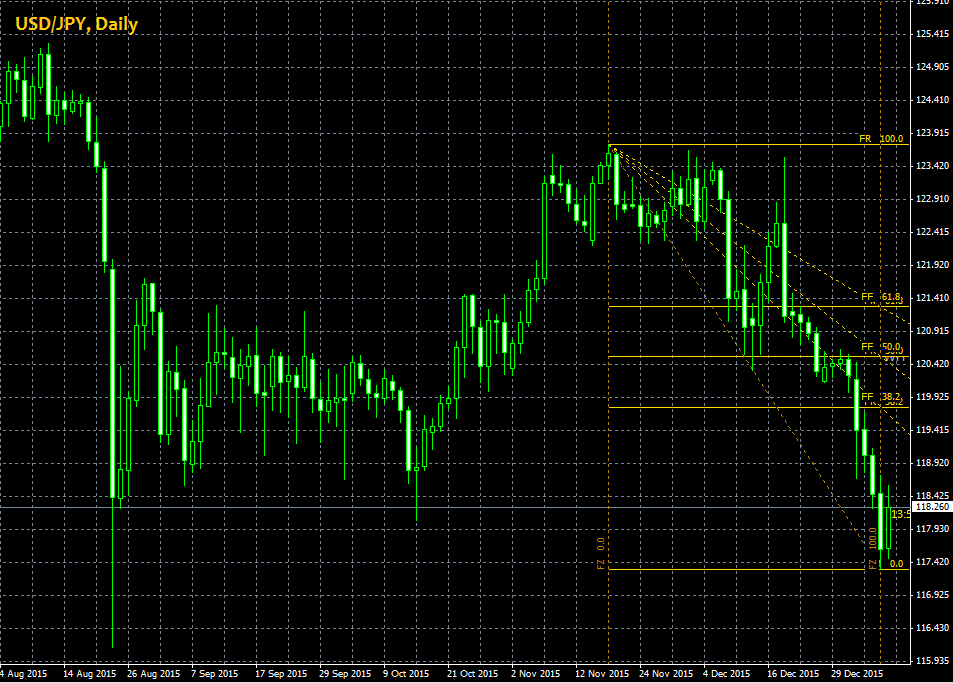
What I mean by that is the point that arguably, all the best price pattern only works when you understand how they should perform in specific situations. Let me give an example of why this can even matter more as you learn how to use price pattern:  The USD/JPY chart above uses the trend line channel price pattern. At first glance, you'll expect the price to keep moving downward. However, the market isn't that predictable. For the hell of it, whatever you draw on your chart won't stop the market to do whatever it wants. Essentially, even the best price pattern can guarantee 100% accuracy as the market moves on random price distribution. Upon that uncertainty, it boils down to your call. Doing the right action at the right time.
What Should You Do to Make the Best Price Pattern Works
Start the basics by reading my introduction for technical analysis. There, you can learn the very basics of identifying the current trend direction with a past price feed. The process of identifying current trend formation and strength matters so much. Without it, the possibility of making the best price pattern works is slim.
Trend reversal marks the best opportunity to enter the market with best price pattern
Let's rewind for a bit, how do you get the best profit from trade? Yes, by buying cheap and selling high. In a case of a trend, it's similar to when the market reverses from its peaks or bottoms. 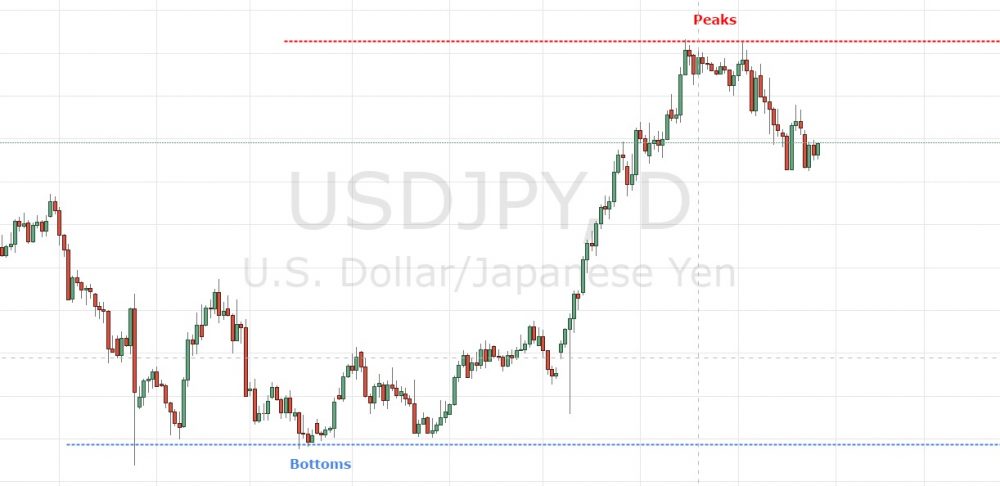
When the price is about to rise to its peaks, traders are alerted as the price reaches its overbought limit. Meaning that not enough buyers to keep the trend hikes up even further. In that condition, it's more enticing for sellers to drive down the price. Conversely, when the price leans to bottom levels and it bounces around that limit it means that the sellers are packing up their baggage and about to leave the market.
This is where the price is at its cheapest, and where the buyers ready to whack that buy buttons. As you can see above, the price reverses a big-time when it hits either bottoms or peaks limit. You can practically reap about hundred of pips if you hold your position long enough. Next, we'll learn how to use best price pattern for detecting possible reversal signal.
Don't Rush, Wait for the Best Opportunity
Trend Reversal price pattern stresses more about executing proper preparation at the right time rather than random trials. That means you should consult to your trading journal to set Stop Losses, Take Profits, and position sizing before reacting to a price pattern. Under similar market conditions, the trading journal acts as a template, so you don't have to set up from a scratch all over again.
Read more: Learn the basic of the trading journal
Make preparation by revisiting your trading journal before reacting to best price pattern
When you're prepared, now it's time to get a reversal signal from the best price pattern! Y'know, there are millions of price pattern out there, but from my experience, these are the actual beast because they are simple and practical:
a. Double tops/bottoms
Double tops/bottom signals imminent reversal as the price bounced twice from its limit. It tells us that either a new stream of buyers or sellers are unwilling to go with the flow (y' catch my drift, mate?). So, rather than pushing the bottleneck, they tacitly agree that it's more efficient to go the other way. 
best price pattern: double tops
b. Triple tops/bottoms
You want a simple explanation, right? Triple tops/bottoms simply work like double tops/bottom but it only happens when the market is a bit more insistent on pushing that bottleneck. But, meh, they eventually give up.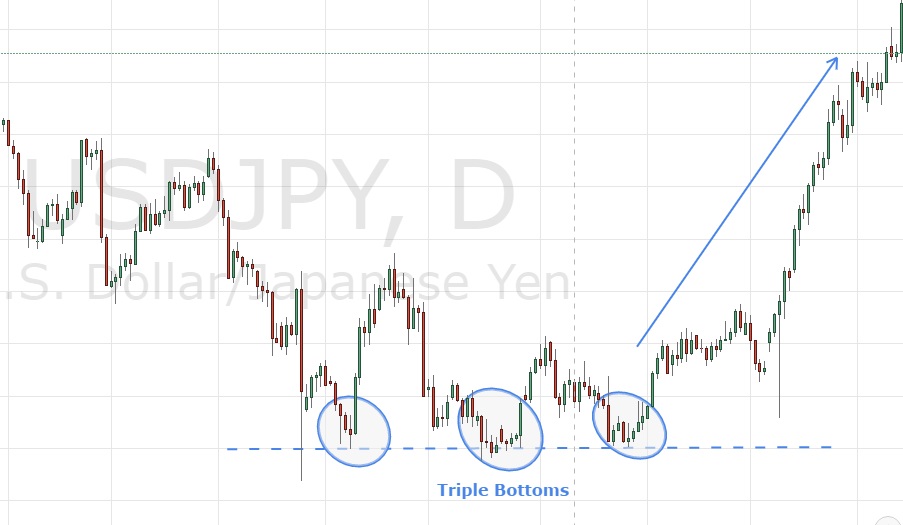
best price action: triple bottoms
c. Head and shoulder
Probably one of my favorites as this price pattern is slightly more accurate than the previous two. The head and shoulder formation inform us that flock of buyers was trying to continue their rally, forming the head. Thereafter, the sellers drove down the price back to the "neckline" level. So, yeah, the buyers tried to seize the control by lifting the price again. Unfortunately, the third buyers' rally was only as high (or even lower) as the previous shoulder, implying that the bulls failed hard to create higher high than the head. The omen comes to a full circle as the sellers take over, y'dig?
best price pattern: head and shoulder
Important to note, those best price pattern above only signals the likelihood of reversal. In PR lingo, the risk of a fake signal is subject to actual market conditions, where no one can stop what the majority feels like doing.
Best Price Pattern only inform the most likely direction of future price, so there's no 100% guarantee
So, even though your chart pops out this or that signal, it won't mean that the whole market will also follow suit. That's why it's not recommended to rush every single flashing signal from any price pattern formation. Only wait for the best moment in a higher time frame (above H4). Just remember that a higher time frame forms more valid and noise-free price patterns than the lower ones.
Is That All?
As I said before, there are myriads of price patterns out there. And by that, I mean this article is only the tip of the iceberg. If you want to look for more best price patterns, please comment below, so there should be enough nudges as to why I should keep more of them coming!