 Dedicated FREE FOREX VPS
 Free FOREX Virtual Private Server
 MT4 Demo Contest, Get $500
 Sign Up for an Account, Claim 60% Deposit Bonus
 Free MT4/MT5 VPS 2024
 Send E-mail and Get Free Merchandise
 $1K Refer a Friend Bonus for Pepperstone Pro clients
 Maximize Your Earnings with 100% Deposit bonus
 Trade to Win, $5,000 Monthly Demo Contest
 Claim 30% + 15% Deposit Bonus from LiteFinance
One of the most effective ways to recognize a reversal is through a head and shoulders pattern. How so? Is there an easy way to trade this pattern?
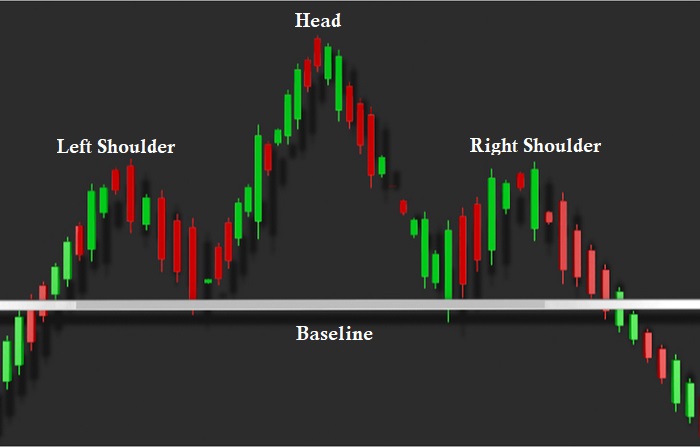
A head and shoulders pattern is a price movement that looks like a baseline with three peaks. In this pattern, the central peak is the tallest and the two peaks on either side of it are slightly lower. In the area of technical analysis, a head and shoulders pattern typically indicates an approaching switch from a positive to a negative trend. In other words, from a bullish to a bearish trend.
There is widespread agreement that the head and shoulders pattern is one of the most effective trend reversal patterns. It is one of the numerous top patterns that warn, with varying degrees of precision, that an uptrend is nearing its end. The head and shoulders pattern is formed typically with the following process:
- The price rises until it reaches a swing high (top).
- The price retreats back only to rise even further and form an even higher top, thus concluding a "head". At this point, the precious top becomes the "left shoulder".
- The price seemingly corrects itself, tries to form a top, but fails to reach the previous one. It is then called the "right shoulder".
How to Trade This Pattern?
Following the peak of the right shoulder in the head and shoulders pattern, we wait for price movement below the baseline once. When a breakthrough takes place, the baseline is broken and you enter a position. You should know that this is the most typical entry point.
Another entry point demands additional patience and the risk of the move being missed entirely. After a breakthrough has occurred, this step involves waiting for a pullback to the neckline. This is more conservative since we can see that if the pullback ends and the original breakout trend restarts. It is important to note that the trade may be lost if the price continues to move in the breakout direction without having a pullback.
See Also:
What Is Inverted Head and Shoulders?
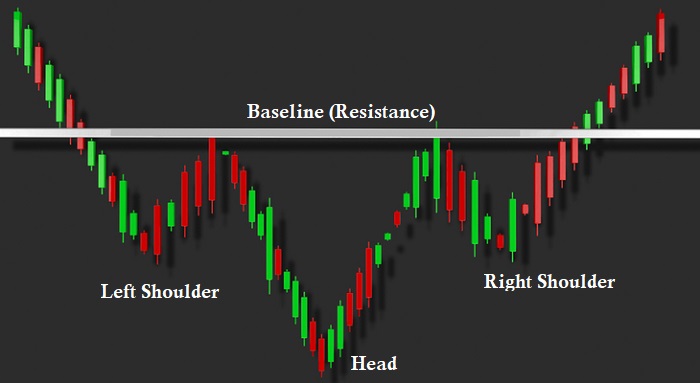
Inverse head and shoulders pattern is also known as head and shoulder bottoms. These are the graphs that appear when you turn a head and shoulders chart upside down. It is an inverted version of the regular head and shoulders chart pattern. This pattern may be recognized whenever the price movement of an asset exhibits all of the following features in the appropriate combination:
- Firstly, the price drops until it reaches the utmost bottom, at which point it begins to climb.
- Secondly, after another increase, the price drops to a level lower than the previous rock bottom, and then it begins to rise once more.
- Thirdly, the price drops once more, but not as far as the second rock bottom.
- Finally, as soon as the last dip is formed, the price begins to move upward, eventually meeting resistance somewhere in the region of the highest point of the prior rock bottoms.
How Reliable Is It?
At the end of the day, it's best to adhere to positions that fit your appetite for risk. This is the only way you can reach your trading goals. In an industry that is usually unpredictable, the head and shoulders pattern has proven to be a fairly reliable trading strategy.
It is also one of the only chart patterns that are easiest to spot and quite reliable considering its triple formation. No chart pattern is perfect at predicting the future. But, when the head and shoulders pattern accurately predicts a big change in the trend, it's a great opportunity to make significant profits.
Other than the head and shoulders pattern and its inverted version, there are other noteworthy price patterns ranked by their reliability.