 Dedicated FREE FOREX VPS
 Free FOREX Virtual Private Server
 MT4 Demo Contest, Get $500
 Sign Up for an Account, Claim 60% Deposit Bonus
 Free MT4/MT5 VPS 2024
 Send E-mail and Get Free Merchandise
 $1K Refer a Friend Bonus for Pepperstone Pro clients
 Maximize Your Earnings with 100% Deposit bonus
 Trade to Win, $5,000 Monthly Demo Contest
 Claim 30% + 15% Deposit Bonus from LiteFinance
Many believe that relying on candlestick patterns alone is not good enough, so combining it with other indicators is a great way to improve the trade.
Most novice traders make their mistakes when they treat a single candlestick pattern as a trading signal. It is essential to understand that candlestick patterns have little value if we don't see them in the right price action context. Patterns alone usually don't have enough power to reverse the trend of the market.
Apart from that, it would be really helpful if you combine the candlestick patterns with other indicators. In fact, combining indicators together is a common practice for traders and one of the keys to a successful trading strategy.
Here are some combinations of candlestick and indicators that are commonly used by many traders:
- Candlestick patterns and moving averages
- Candlestick patterns and oscillators
Markets are highly complex and are unlikely to unfold with only one indicator. So the more indicators you use wisely, the more accurate your predictions will be. There are various indicators that you can use and combine with candlestick patterns, but this article will specifically discuss the moving averages and oscillators.
Candlestick Patterns and Moving Averages
Moving Averages is one of the simplest technical indicators. It is a straightforward yet powerful tool that can be used to analyze the price movement along with candlestick patterns.
While candlestick patterns put more emphasis on the short-term buy/sell balance, moving averages can contribute by giving a bigger picture or the trend context. Using candlestick patterns and moving averages therefore can help you confirm the trend and make a better prediction.
There are various techniques of using moving averages, such as moving average crossover, rainbow strategy, etc. But this time around, we will focus more on the relationship between candlestick patterns and moving averages and how to best use them in a trade.
Why Use Moving Averages?
Moving average is a great tool that can measure the average price of an asset over a certain period. From there, it can show us the market strength as well as the current market trend. Moving averages will move along with the prices as new bars appear. So when the price hits a higher price, the moving average will move up too.
The same goes when the price goes down to a lower price, in which the moving average will move down accordingly. That is why moving average is commonly used as a base technical analysis that traders could add as an extra technical indicator to compliment the main trading plan for more accurate prediction.
The Setting
- Moving Average Type: Simple Moving Average (SMA).
- Moving Average Period: 30.
- Candlestick Chart: 5-minute.
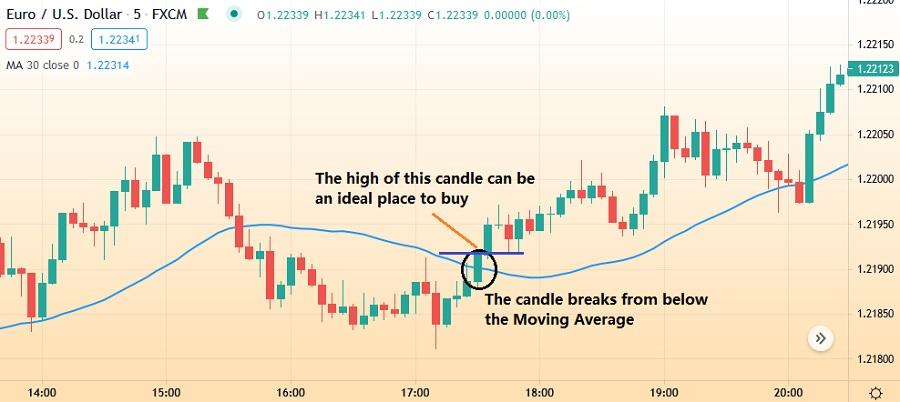
The Buy Setup
- See if there's a bullish candlestick that appears after a downtrend/range market.
- See if the candlestick breaks through the Moving Average from below.
- Place a buy entry at the High the moment it broke through the Moving Average.
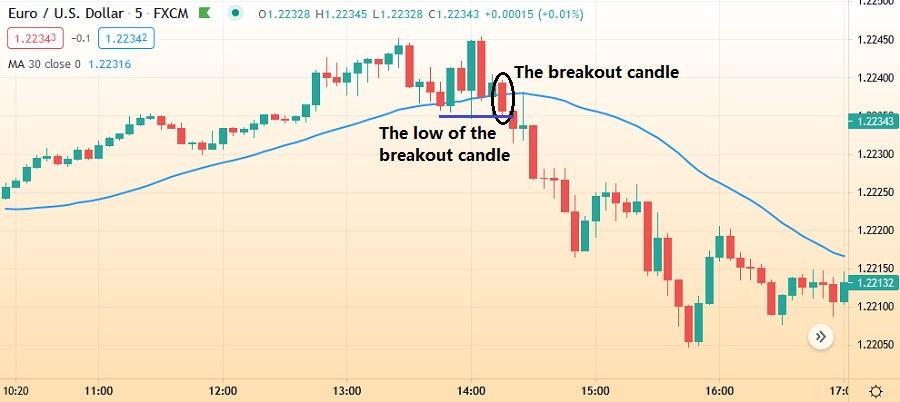
The Sell Setup
- See if there's a bearish candlestick appears after an uptrend/range market.
- See if the candlestick breaks through the Moving Average from above.
- Place a sell entry at the low of the price the moment it broke through the Moving Average.
Candlestick Patterns and Oscillators
Although both candlestick patterns and oscillators can be used independently, using them together would give you a great insight into short-term trading opportunities as well as the market direction and momentum. Thus, this combination is perfect for swing traders who specialize in using technical analysis to take advantage of short-term price movements.
Swing traders typically look for short-term reversals in order to capture forthcoming price moves. They would ride the wave in one direction for a certain period of time before switching to the opposite part of the trade when the asset changes direction.
The first step is figuring out the suitable condition for reversal, which can be seen in either candlesticks or oscillators. Candlestick reversals are characterized by indecision candles or candles that show a strong shift in sentiment.
While on the other hand, reversals in oscillators can be seen in the divergence.
Oscillator Divergence
Divergence in oscillators happens when the price is moving in the opposite direction of the indicator. Think of it as throwing a ball up in the air; it will eventually lose its momentum before it reverses direction. The same principle happens here too.
Momentum slows before the price reverses, and divergence indicates that the momentum is slowing down so a potential reversal is about to come. Keep in mind that not all reversals are signaled by divergence, but most of them are.
Although divergence doesn't always need to exist, if you spot one, then the candlestick reversal patterns are more likely to be more powerful and result in better trades.
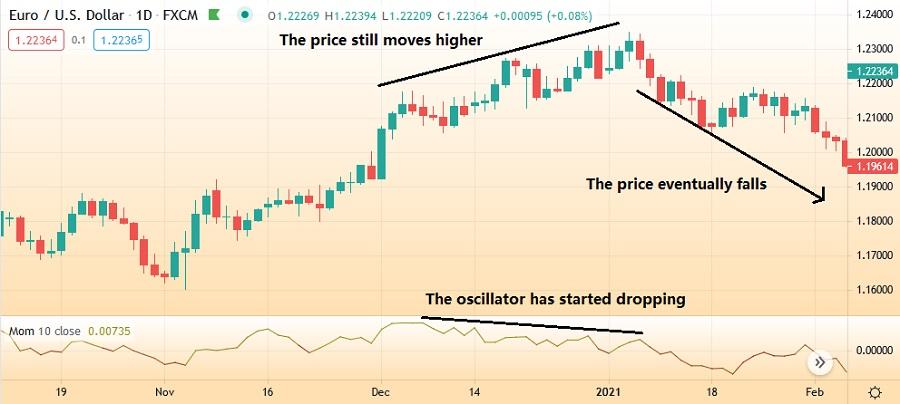
The following charts show divergence in an oscillator. We can see that while the trend in the chart is going upward, the oscillator shows quite the opposite because the line is moving slower and going down.
The divergence basically indicates weakness in the trend, which you can confirm by looking at the price action. The price could barely make new highs before falling again. Eventually, the price drops down significantly.
Now once you are able to find the divergence on the chart, the next step would be to define an exact point of reversal. This is where the candlestick patterns come into play. There are more than 50 patterns that you can use, but this time we will focus on only two of the more common ones.
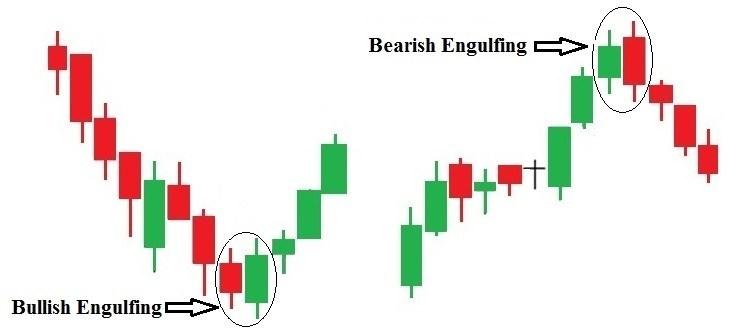
Bullish and Bearish Engulfing Patterns
Engulfing patterns are some of the most prominent candlestick patterns in the market. Basically, there are two kinds of engulfing patterns: bullish and bearish.
A bullish candlestick pattern always appears in a downtrend. It is characterized by the price moving lower, typically shown via red or black candles. Then after that, there's a large candle often colored in green or white, which is larger than the previous bearish candle.
The up candle must completely envelop the previous down candle, which indicates that strong buying has entered the market. You can start trading near the close of the bullish engulfing candle or near the following open.
The same concept goes to the bearish engulfing pattern, but in the opposite way. The price should be going up and then there's a large down candle that envelops the last up candle. This means that the sellers are entering the market aggressively.
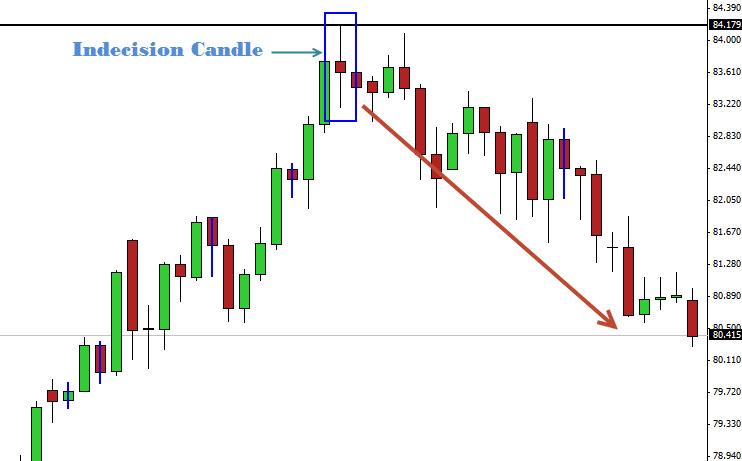
Indecision Candlesticks
Another commonly used candlestick pattern is the spinning top pattern. It consists of a tiny body with long tails. The pattern shows indecision because there is volatility throughout the period, but by the end of the time, the price is near where it started.
While spinning tops may occur on their own and signal a trend reversal, sometimes there are two or three that occur together. The price will then make a drastic move in one direction or the other, and close in that direction as well. That is the direction to trade-in.
Combining Candlestick Patterns and an Oscillator
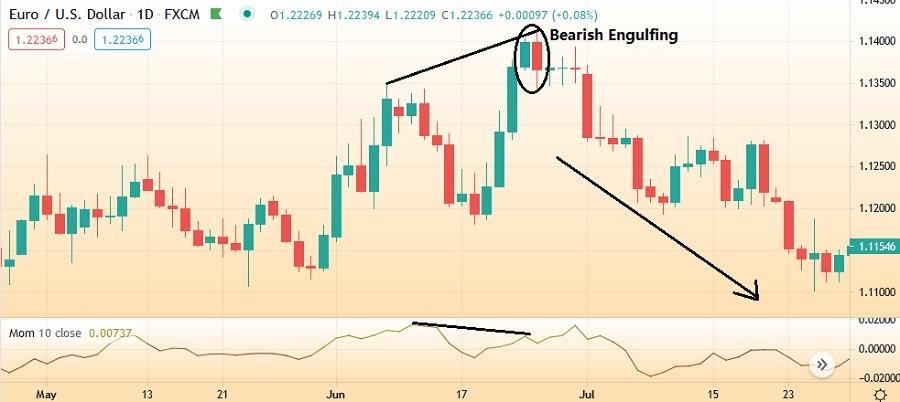
Here's the first example of the combination between candlestick patterns and an oscillator. The following chart shows a strong divergence because while the price is moving upward and forming highs, the momentum indicator is dropping.
Just after setting a new high, the price created a strong bearish engulfing pattern and the price starts moving downward.
The indecision candles work similarly to the engulfing ones. When there's divergence present on the chart, indecision candlesticks would signify the turning point of the price movement. We can expect the price to start reversing after the reversal pattern is confirmed.
The Bottom Line
Combining candlestick patterns with other indicators such as moving averages and oscillators is definitely a great idea to improve the outcome of your trade. While each of them can be used separately, using them together would significantly enrich your analysis. It can confirm the trend's strength and direction, as well as helping you figure out the bigger picture or the context of the trade.
As a result, you would be able to make better predictions for future trades. However, despite using several tools to confirm the accuracy of your analysis, risk management is always necessary. Also, make sure to learn about each tool before you use them and always stay cautious for unexpected risks that may come into play.


2 Comments
Irvin
Jan 26 2024
According to the article, it appears to integrate candlestick patterns with indicators, with a particular focus on the intriguing engulfing patterns, both bearish and bullish. The article suggests that when these engulfing patterns manifest, trading opportunities arise, such as executing bullish trades through buying and bearish trades through selling.
Now, I'm curious about the accuracy of the engulfing strategy. Having perused numerous articles, it seems that about 6 or 7 out of 10 articles advocate for the engulfing strategy. I'm eager to understand the reliability of this approach and hope to find an explanation in this context.
Oliver
Jan 29 2024
Let me explain to you. About how accurate the strategy that you said, there is no accurate strategy!
The engulfing strategy, which combines candlestick patterns with indicators, particularly focusing on bullish and bearish engulfing patterns, is a popular approach in trading. The idea is to spot potential trend reversals and take advantage of trading opportunities when these patterns occur. However, the reliability of the engulfing strategy varies.
Success in trading depends on factors like market conditions, timeframe, and confirmation with other indicators. It's like having a toolbox – the more tools you use, the better. Risk management is key, too; setting stop-loss orders and managing position sizes can help mitigate potential losses. Backtesting, considering different timeframes, and staying mindful of current market conditions are essential. While the engulfing strategy is widely discussed, it's crucial for traders to continuously educate themselves, adapt strategies, and recognize that no strategy is foolproof. Always be open to learning from experienced traders and financial professionals to refine your approach.