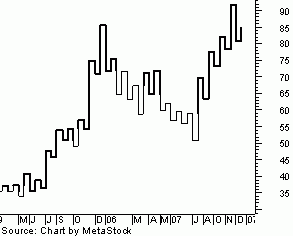
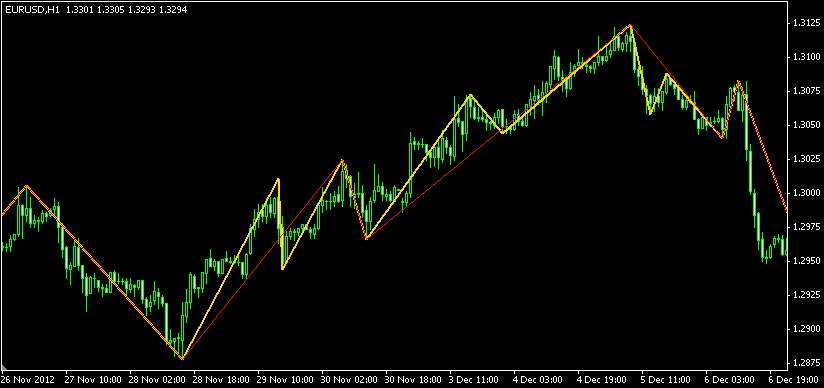
Kagi charts, based on the concept of noise removal, are among the most significant tools for an active foreign exchange trader.
Kagi charts, based on the concept of noise removal, are among the most significant tools for an active foreign exchange trader. They are said to be responsible for the successful dodges of false signals and they are a reason why a trader can predict market action more effectively. Although traders of all levels can make use of them to determine profitable positions, the graphs can be quite complex, and are, therefore, best left to the more experienced bunch.
Kagi Charts 101
Kagi charts, composed of a set of vertical and horizontal lines that vary in thickness, give more importance to price action compared to their reliance on time variables. There remains no single entity linked to their development; it was revealed, however, that they originated from Japan and were first used to monitor the price action of rice, as well as the Japanese economy's supply and demand levels.
What to keep in mind
- The line will change its direction once a reversal amount is reached.
- The line will change its color/boldness one the price (of the trend it's following) is under or over the previous line.
A Systematic Approach
Following the rules of the Kagi charts may not be difficult. However, drawing vertical lines from a starting point to the closing prices needs consistency. The trick is to have a keen eye for detail by ensuring that you're plotting trend lines that have not gone through trend reversals. Otherwise, you're bound with no other option but to go back to the first step. Simply put, using the graphs is a lot like using line charts; the main difference is that lines can vary in boldness and pursue various directions.
Steps:
- Determine a starting point.
- From the starting point, draw vertical lines toward the first closing price, extending toward the second closing price, then on to the third closing price, and so on.
- Plot two lines according to the closing price of the previous day.
- If the closing price is greater than / equal to the previous closing price: (1) plot a bold vertical line and (2) pursue the trend of the current horizontal line.
- If the closing price is less than the previous closing price: (1) plot a thin horizontal line and (2) create a new, thin vertical line.

 Dedicated FREE FOREX VPS
 Free FOREX Virtual Private Server
 MT4 Demo Contest, Get $500
 Sign Up for an Account, Claim 60% Deposit Bonus
 Free MT4/MT5 VPS 2024
 Send E-mail and Get Free Merchandise
 $1K Refer a Friend Bonus for Pepperstone Pro clients
 Maximize Your Earnings with 100% Deposit bonus
 Trade to Win, $5,000 Monthly Demo Contest
 Claim 30% + 15% Deposit Bonus from LiteFinance


