Dedicated FREE FOREX VPS
 Free FOREX Virtual Private Server
 MT4 Demo Contest, Get $500
 Sign Up for an Account, Claim 60% Deposit Bonus
 Free MT4/MT5 VPS 2024
 Send E-mail and Get Free Merchandise
 $1K Refer a Friend Bonus for Pepperstone Pro clients
 Maximize Your Earnings with 100% Deposit bonus
 Trade to Win, $5,000 Monthly Demo Contest
 Claim 30% + 15% Deposit Bonus from LiteFinance
As simple as its sound, there is a lot to learn when it comes to maximizing a powerful tool like the Simple Moving Average (SMA). Come find some takeaways here if you're an aspiring day trader.
Forex trading cannot be done properly without a good analytical tool and how to find signals on it. There is this one particularly popular tool called Simple Moving Average (SMA) that averaging changes in price into a single line and makes it easier to read.
What Simple Moving Average indicator does is adding a single smoothly flowing line on top of all those bars or candlesticks and gives you an insight of both resistance and support's position. This indicator creates that line by looking back for a certain period of time; the farther it goes back, the smoother it will be. However, this indicator did not react quickly to the changes in the price unlike the Exponential Moving Average.
In day trading, Simple Moving Average is used to predict the market trend and what seems to be a potential reversal. Traders often translate the crossing between the line and the price as a signal to enter. Sometimes, they react as support and resistance as well. This tool may be used as an indicator or as a base for another indicator, so there are many ways of using this simple technical tool.
Those traits are beneficial to day traders as they can assist in making a decision to enter the market. Here are 3 main day trading strategies that you can try using the SMA indicator:
Mean Reversion
As the name implies, this strategy relies on the price's return to the mean. Many people believe that it can only go as far up or down until it eventually gets back to its mean. Traders often calculate this strategy either using a 50-day Smooth Moving Average or 100-day Smooth Moving Average. Be advised, the price may move at a slow pace and therefore require another technical indicator in order to make a well-reasoned prediction whether the price is still following the current trend or actually going in reverse.
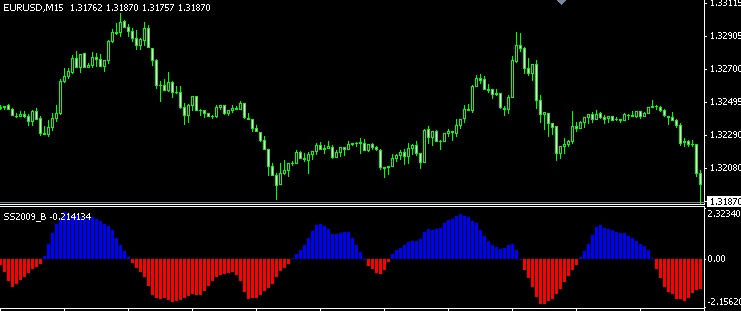
Oscillator
You can also utilize the SMA tool to do what is called Counter-trend Trading. Simply put, Counter-trend Trading is maneuvering against the market; place a buy position when the trend is going down and look for a sell position when the trend is going up. It may sound outrageous but traders who can correctly figure out when the price is bouncing from resistance or support levels often do that.
We can use SMA to identify opportunities from price reversals by combining a few indicators together. Assuming that you already have a 200-day SMA in place, you just need to add a second one such as a 10-day or 30-day SMA. The current trend would be considered bullish if the 10-day SMA line is above the 30-day Moving Average and the current closing price is above the 200-day SMA. Finally, you use the oscillators to see any short term price pullback in the main trend direction. Now you should see where the trend is going and react accordingly.
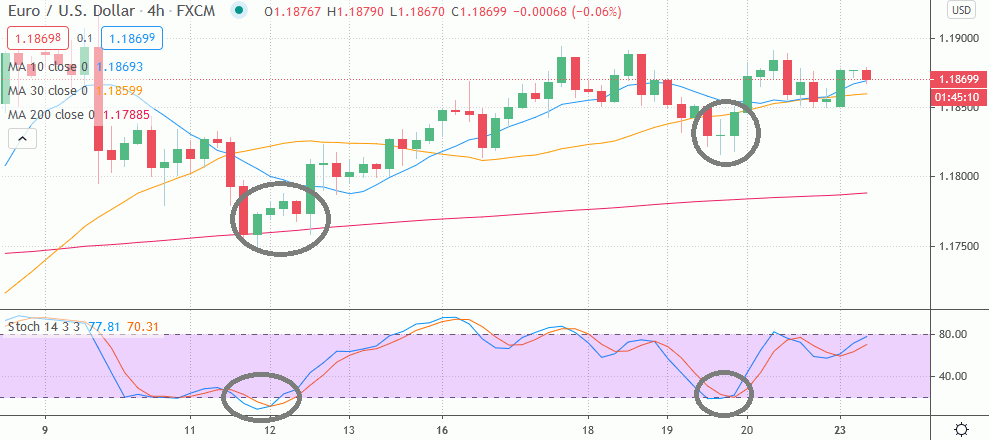
The EUR/USD chart above shows that the price is currently in a bullish trend, as indicated by its position above the 200-day SMA (the red line). In some ways, reversal opportunities can be optimized by the pullbacks. They are confirmed with the oversold signals detected from the Stochastic Oscillator (shown in the grey circles).
See Also:
SMA Crossover
In this strategy, you could combine the 50-day SMA with the 200-day SMA. When the 50-day SMA is crossing over the 200-day SMA line, that is one good signal to enter a buy position. That particular crossing is called the golden cross. There is also another important signal to enter the sell position, that is when the 50-day SMA line crosses below the 200-day SMA. Said crossing is referred to as the death cross.
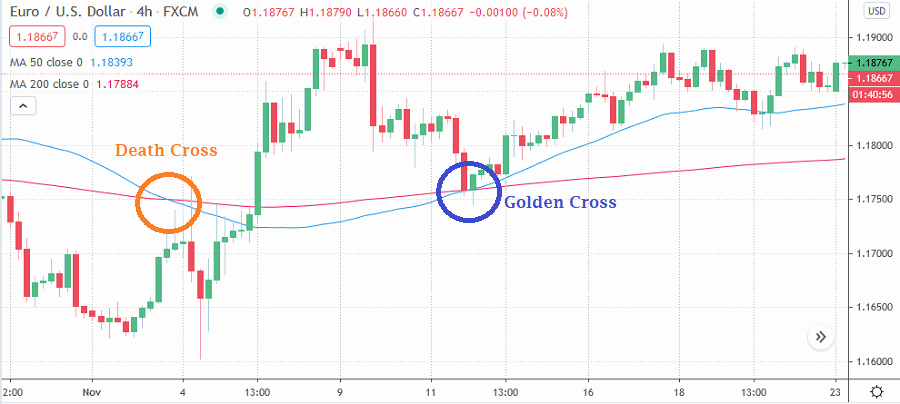
Aside from the combination of 50-day SMA and 200-day Moving Average, some traders also use 10-day SMA and 20-day SMA simultaneously to find both the golden cross and the death cross. In fact, the setting of Moving Average lines is not a fixed rule as all traders are free to use whichever period they deem fit. As long as the setups have been tested and proven profitable for their system, there is nothing wrong with combining Moving Average lines from various periods.
Despite all the signals it can give, be advised that Moving Average works by calculating historical data and the current end of the line might seem to be moving randomly. Therefore, we encourage you to apply extra indicator(s) that is predictive in nature. A collaboration of several indicators can make a confirmed signal to avoid noises, especially if you are intraday trading in some relatively small time frames.