 Dedicated FREE FOREX VPS
 Free FOREX Virtual Private Server
 MT4 Demo Contest, Get $500
 Sign Up for an Account, Claim 60% Deposit Bonus
 Free MT4/MT5 VPS 2024
 Send E-mail and Get Free Merchandise
 $1K Refer a Friend Bonus for Pepperstone Pro clients
 Maximize Your Earnings with 100% Deposit bonus
 Trade to Win, $5,000 Monthly Demo Contest
 Claim 30% + 15% Deposit Bonus from LiteFinance
Many traders like to use moving average to trade because of its simplicity and ease of use. But what if we use 3 EMA lines at the same time? Does it stay true for easy trading?
Exponential Moving Average (EMA) is one of the most popular technical indicators used by forex traders worldwide. Despite its lagging nature, EMA can help traders read the market condition and build the basis of their trading strategy.
In this article, we will be using the following three moving averages to identify signals on the chart:
- 9 EMA as the short-term trend indicator
- 21 EMA as the medium-term trend indicator
- 55 EMA as the long-term trend indicator
The idea is that by using three moving averages at once, you will be able to see the current direction of price on the chart as well as determine stop losses, trailing stops, and profit targets for further safety. The main benefit of using this strategy is that it can show whether the shorter-term trend is going in a favorable direction. The shorter-term trend can confirm the longer-term moving average and show a divergence.
Without further ado, let's find out how this strategy works in the explanation below.
Contents
Understanding the Three Moving Averages
- 9 EMA, which acts as the shorter-term trend indicator. If the 9 EMA line crosses over the 21 EMA line but is still above the 55 EMA, that means it is an uptrend and a good long opportunity. Meanwhile, if it crosses below 21 EMA and 55 EMA, then it is a downtrend and a good short opportunity.
- 21 EMA is considered the medium-term trend indicator, so what we would want to see is when the 21 line is below the 9 and above the 55 for an uptrend. In comparison, the 21 EMA line should be above both the 9 and 55 lines to confirm a downtrend.
- 55 EMA, which represents the longer-term trend direction. If the 55 EMA is below both the 9 and 21 EMAs, the trend is going upward. In contrast, if the indicator is above both of the shorter-term moving averages, then we can see that the trend is going downward.
Before we set up our charts, we should check the market condition by looking at the state of the moving averages. There are at least 4 key principles that we must remember:
- If the indicators are all tangled together, that means the market is in a trading range.
- If the 9 and 21 EMAs are crossing and then separating, that means it is a trending market.
- If the faster moving average starts to pull away from the others, then there is momentum to enter the market.
- If all of the indicators are lining up, then there is a strong trend going on.
Now that we examined the market condition, we can determine what type of trading setups that we need to enter the market.
See Also:
3 EMA Scalping Strategy for Buy Position
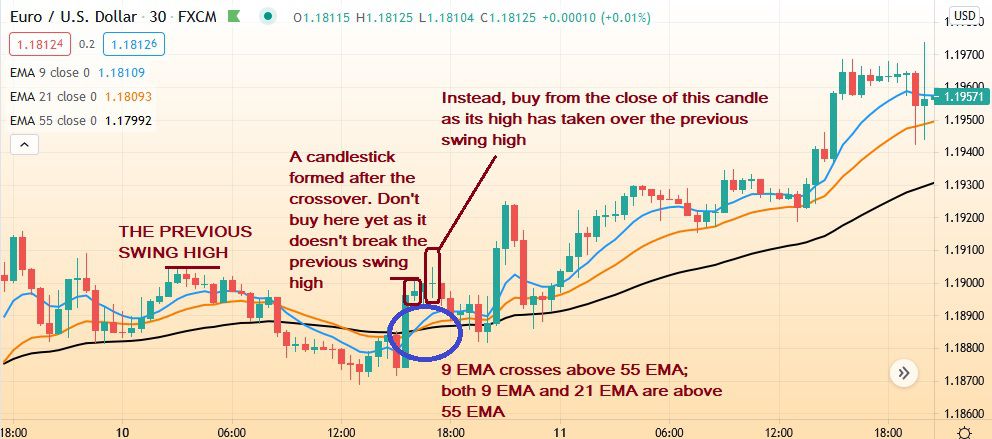
- Look for the lineup of 3 EMA lines in the same direction.
- Wait until the 9 EMA crosses above 55 EMA and both 9 and 21 are above 55.
- Place a buy order on the next candle after the crossover.
- Pay attention to the swing high on the left side; we should only buy from the close of the candlestick that takes out the previous swing high.
3 EMA Scalping Strategy for Sell Position
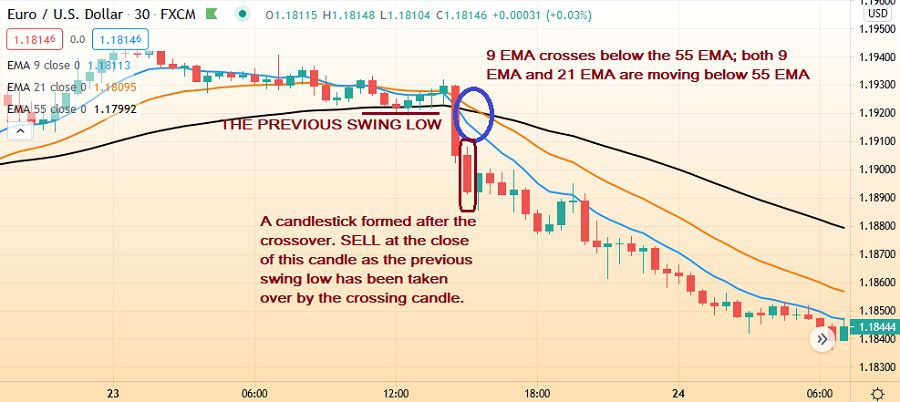
- In this setup, we would be paying attention to the lowest swing low of the range because it needs to be broken to consider opening a short position.
- Make sure that the 9 EMA has crossed below the 55 EMA and that both 9 and 21 EMAs are below the 55 EMA.
- Sell the close of the candlestick following the moving average crossover.
- Watch for the swing low on the left side; we should only sell from the close of the candlestick that takes out the previous swing low.
Where to Place the Exit Position
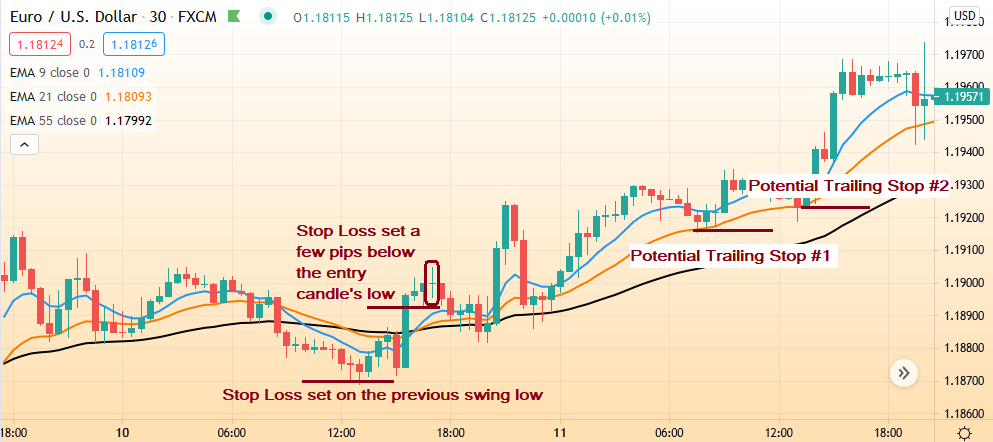
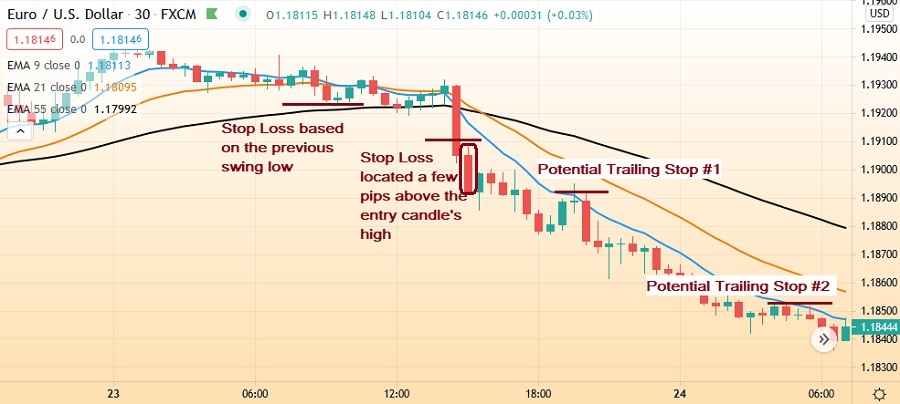
Essentially, there are many ways of placing your stop loss in this type of strategy. What needs to be considered is that you must allow room for the price to move, so don't place it exactly on the line but also don't put it too far away either.
The second important thing is to be consistent with your stop losses. In a buy trade, you can place your stop loss at least 2-5 pips below the low of the candlestick that has its high broken. You can also place your stop loss a few pips outside of the support level if there is one nearby. As for the sell trade, you can place your stop loss at least 5 pips above the high of the entry candlestick.
Now when it comes to take profit, you can use the previous swing low or high as your profit targets. Another option is not to place a fixed profit target but use a trailing stop behind each lower swing high or low when the price moves in your favor.
That way, you can ride on the trend a.k.a getting maximum profits until you get stopped out. Trailing stops will also enable you to lock in profits in case of sudden reversal that may take out your profits immediately.
Here are how the stop loss scenarios for a buy trade can unfold:
Meanwhile, the stop loss placements for a sell position are as follows:
Final Thoughts on the 3 EMA Scalping Strategy
Having three moving averages at once like in the 3 EMA scalping strategy will make your judgment even stronger and more accurate. Remember that if the indicators are separated in the averages, we have a trend. If the price is whipping back and forth around the averages, we have a range trend.
All in all, use the indicators wisely and make sure to make decisions based on logical reasons. If you're new to this strategy, make sure to try it on a demo account first before applying the strategy to a real account.


3 Comments
Kalpesh
Sep 3 2022
I want to learn more about the 3 EMA Trading strategies.
Phillips
Jan 10 2024
Hey, I'm a beginner here and getting the hang of things with this article on using 3 EMA for trading. But I'm a bit puzzled. The article mentions in a buy trade, you can set your stop loss at least 2-5 pips below the low of the candlestick that broke its high. Or you can also place it a bit outside the support level if there's one nearby. And for a sell trade, you're supposed to set your stop loss at least 5 pips above the high of the entry candlestick.
Is it normal to set stop losses with just a few pips? I mean, doesn't that increase the chances of the price bouncing back? In trading, when the price hits your orders, it could bounce back, right? I'm thinking if your stop loss is just a few pips, it might miss out on some opportunities. What do you think?
Joshua
Jan 16 2024
Employing tight stop losses is a strategy employed by certain traders to manage risk more closely. The concept is to minimize potential losses if the market moves unfavorably. Yet, as you rightly noted, there's a potential drawback – setting extremely tight stop losses could lead to premature exits, particularly in a volatile market with rapid price fluctuations.
It's a delicate balancing act. While narrow stop losses can safeguard your capital, they must also consider natural price variations and steer clear of being triggered by regular market noise. Even professionals use stop losses, often opting for broader ones. Check this out: Do Professional Traders Use Stop Loss?
Testing out different stop loss positions on a demo account can be worthwhile to figure out what aligns best with your trading strategy and comfort level. Keep in mind, striking the right balance is crucial for effectively managing risk.