GBP/USD has moved between 20 MA and 50 MA on H1 chart. The intraday bias is bullish. Watch the support at 1.50654 -1.51126, if bullish signal confirmed at that area, sterling may strengthen up to 1.51888 -1.52767. Be careful if the support 1.50654 breaks because it will turn the intraday bias into bearish and potentially push sterling down, back to 1.49892.
GBPUSD
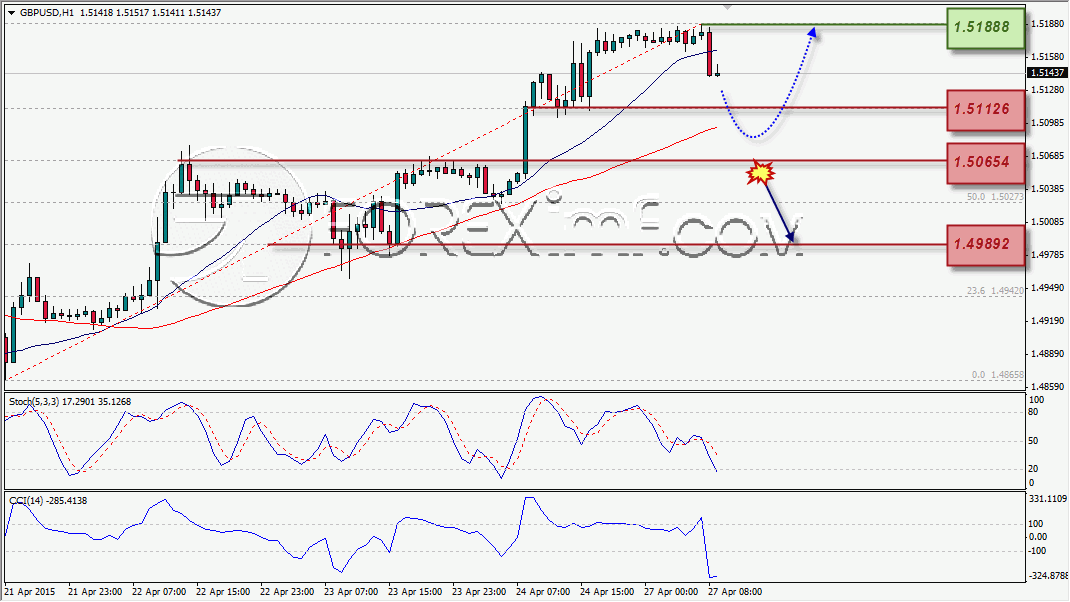
GBP/USD has moved between 20 MA and 50 MA on H1 chart. The intraday bias is bullish. Watch the support at 1.50654 – 1.51126, if bullish signal confirmed at that area, sterling may strengthen up to 1.51888 – 1.52767. Be careful if the support 1.50654 breaks because it will turn the intraday bias into bearish and potentially push sterling down, back to 1.49892.
EURUSD
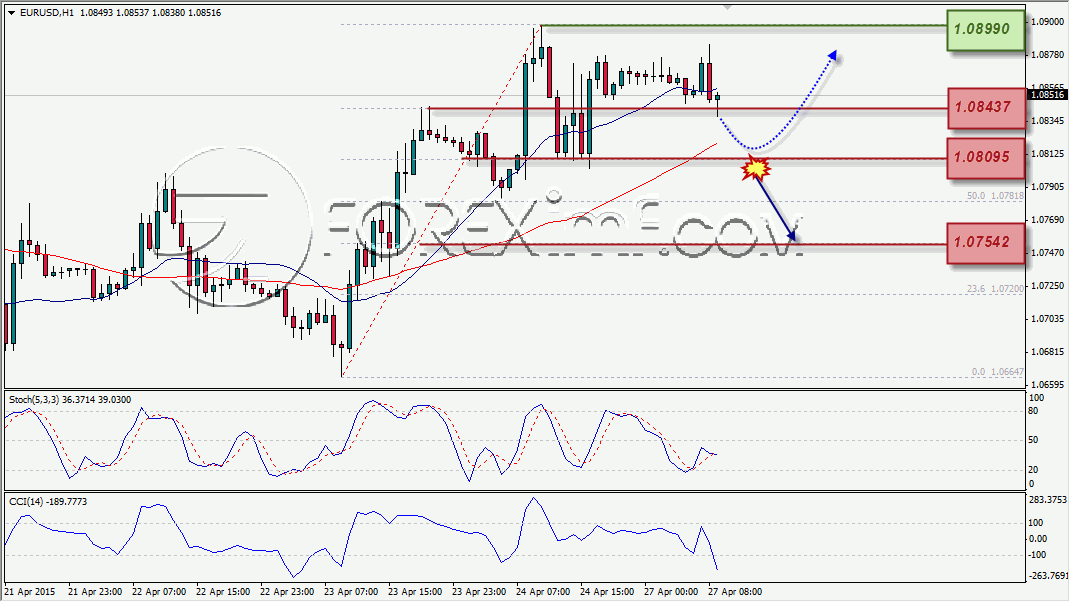
EUR/USD on graph hourly chart looks on bullish condition. Watch the support area at 1.08095 – 1.08437. If pull-back occurs to that area, you can look for buy signal confirmation with target at 1.08990 – 1.09267. Be careful if the support at 1.08095 breaks because it will turn the intraday bias into bearish and potentially will bring euro down to 1.07542.
AUDUSD
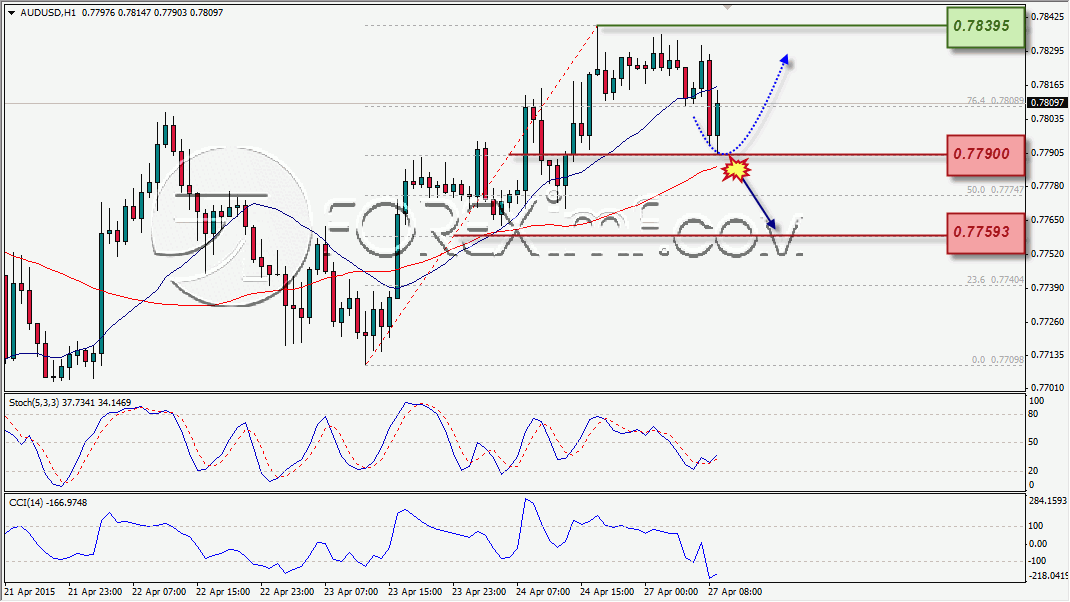
AUD/USD is bullish condition. Bearish bullish is expected to be heavier if the resistance at 0.78395 breaks, with target at 0.78748. As alternative scenario, watch the support area at 0.77900. If pull-back occurs to that area, you can look for buy signal confirmation with target at 0.78395. Be careful if the support at 0.77900 breaks because it will turn the intraday bias into bearish and potentially will bring aussie down to 0.77593.
USDCHF
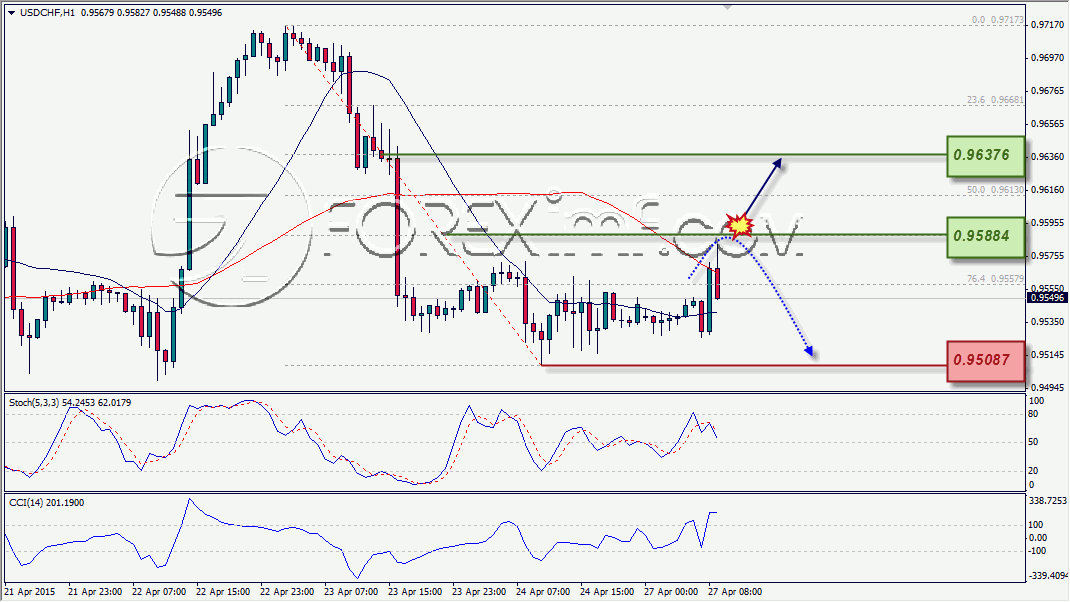
USD/CHF remains under pressure. Watch the resistance area at 0.95884. If pull-back occurs to that area, you can look for sell signal confirmation with target at 0.95087 – 0.94520. Be careful if the resistance at 0.95884 breaks because it will turn the intraday bias into bullish and potentially will raise USD/CHF up to 0.96376.
USDJPY
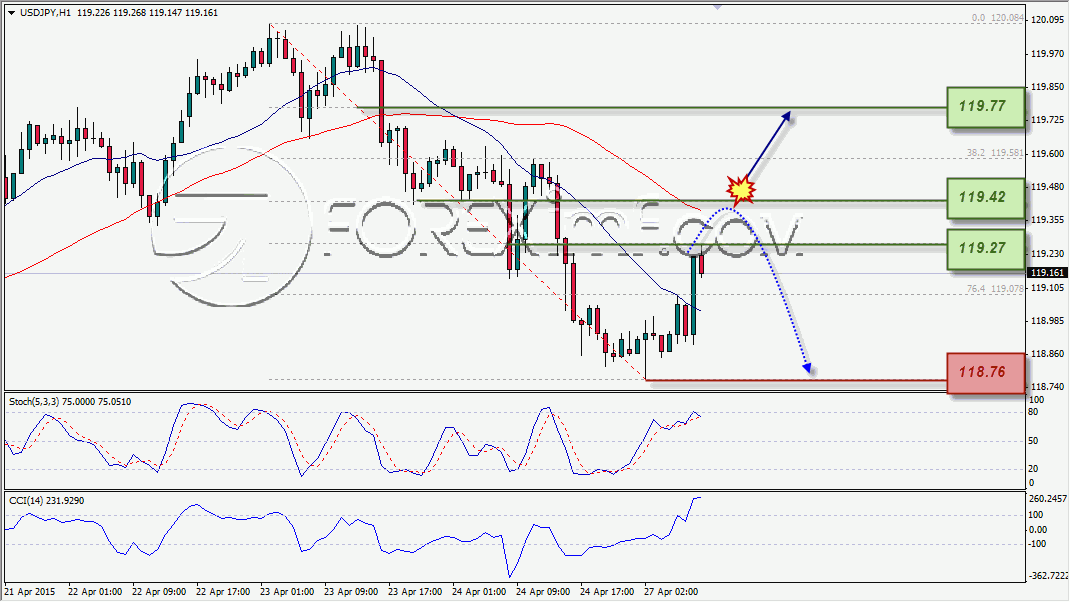
USD/JPY is under pressure. Bearish pressure is expected to be heavier if the support at 118.76 breaks, with target at 118.40. As alternative scenario, watch the resistance area at 119.27 – 119.42. If pull-back occurs to that area, you can look for sell signal confirmation with target at 118.76. Be careful if the resistance at 119.42 breaks because it will turn the intraday bias into bullish and potentially will raise USD/JPY up to 119.77.

 Dedicated FREE FOREX VPS
 Free FOREX Virtual Private Server
 MT4 Demo Contest, Get $500
 Sign Up for an Account, Claim 60% Deposit Bonus
 Free MT4/MT5 VPS 2024
 Send E-mail and Get Free Merchandise
 $1K Refer a Friend Bonus for Pepperstone Pro clients
 Maximize Your Earnings with 100% Deposit bonus
 Trade to Win, $5,000 Monthly Demo Contest
 Claim 30% + 15% Deposit Bonus from LiteFinance


